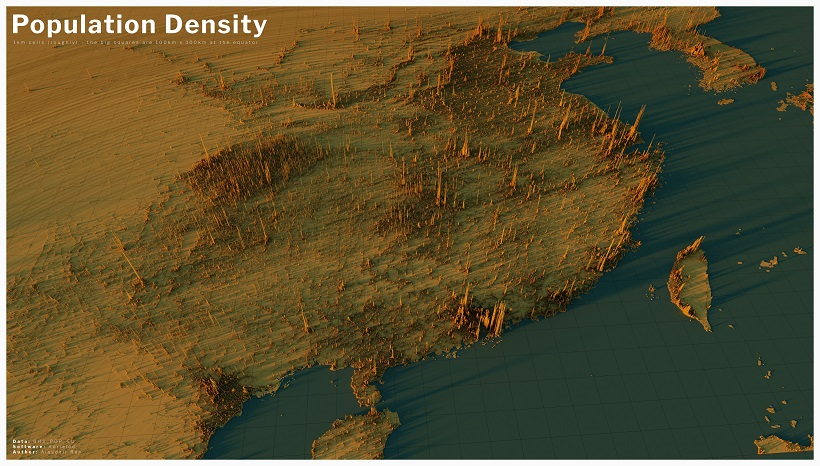
Created using the EU’s population density data and mapping tool Aerialod by Alasdair Rae, the 3D-rendered maps highlight demographic trends and geographic constraints. Though they appear topographical and even resemble urban areas, the maps visualize population density in squares. The height of each bar represents the number of people living in that specific square, with the global map displaying 2km x 2km squares and subsequent maps displaying 1km x 1km squares. Each region and country tells its own demographic story, but the largest population clusters are especially illuminating.
China vs U.S. — Clusters vs Sprawl
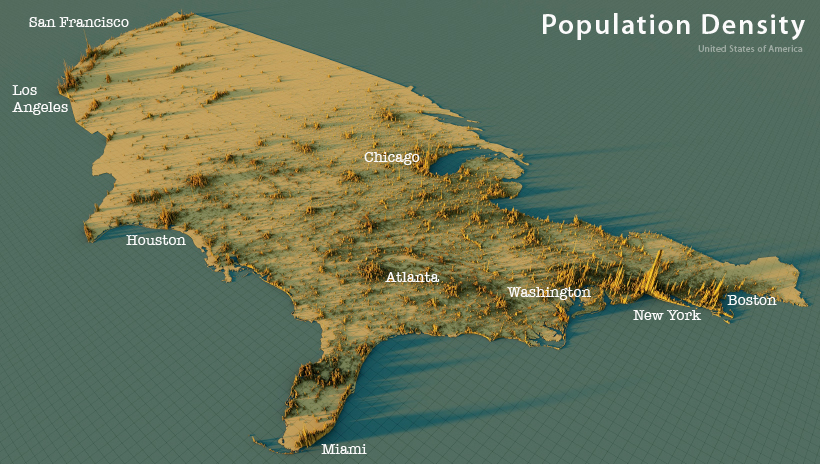
Click here to view the high resolution version. Zooming into the most populated country in the world, China and its surrounding neighbors demonstrate massive clusters of urbanization. Most people are familiar with the large density centers around Hong Kong, Guangzhou, and Shanghai, but the concentration in central China is surprising. The cities of Chengdu and Chonqing, in the Sichuan Basin, are part of a massive population center. Interestingly, more than 93% of China’s population lives in the Eastern half of the country. It’s a similar story in neighboring South Korea and Taiwan, where the population is clustered along the west coasts. Click here to view the high resolution version. The U.S. also has large population clusters along the coasts, but far more sprawl compared to its Asian counterparts. Though the Boston-Washington corridor is home to over 50 million residents, major centers spread out the population across the South and the Midwest. Clearly visible are clusters in Florida (and not exclusively focused around Miami like some might believe), Illinois, Georgia, and Texas. The population is sparse in the West as expected, but California’s Los Angeles and Bay Area metros make up for the discrepancy and are just behind New York City’s density spikes in height.
India & Southeast Asia — Massive Density in Tight Areas
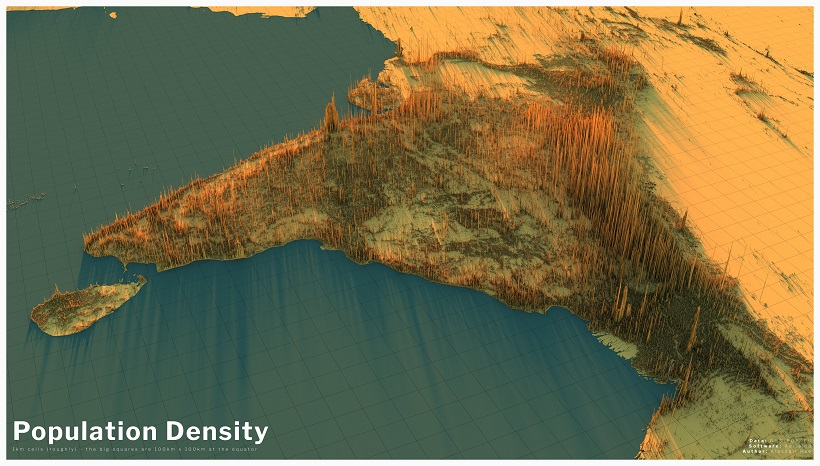
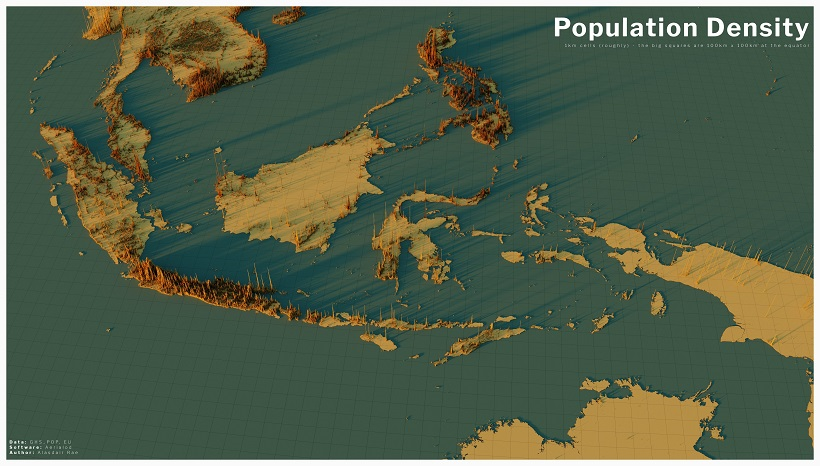
Click here to view the high resolution version. At 1.38 billion people, India’s population is just behind China’s in terms of size. However, this sizable population fits into an area just one-third of China’s total land area, with the above map demonstrating what the same amount of people looks like in a smaller region. On one hand, you still have clear clusters, such as in Mumbai, New Delhi, Kolkata, and Bangladesh’s Dhaka. On the other, there is a finite amount of room for a massive amount of people, so those density “spikes” are more like density “peaks” with the entire country covered in high density bars. However, we can still see geographic trends. India’s population is more densely focused in the North before fading into the Himalayas. Bangladesh is equally if not more densely populated, with the exception of the protected Sundarbans mangrove forest along the coast. And Pakistan’s population seen in the distance is clustered along the Indus River. Click here to view the high resolution version. Geographic constraints have always been the biggest deciding factor when it comes to population density, and nowhere is this more apparent than Southeast Asia. Take Indonesia, the fourth largest country by population. Despite spanning across many islands, more than half of the country’s 269 million inhabitants are clustered on the single island of Java. The metros of Jakarta and Surabaya have experienced massive growth, but spreading that growth across oceans to entirely new islands (covered by rainforests) is a tall order. When the distance is smaller, that cross-water growth is more likely to occur. Nearby in the Philippines, more than 100 million people have densely populated a series of islands no bigger than the state of Arizona. Indeed, despite being one of the most populated areas in the world, each country in Southeast Asia has had its own growing problems. Some are limited by space (Singapore, Philippines), while others are limited by forests (Thailand, Vietnam).
A World of Different Density Pictures
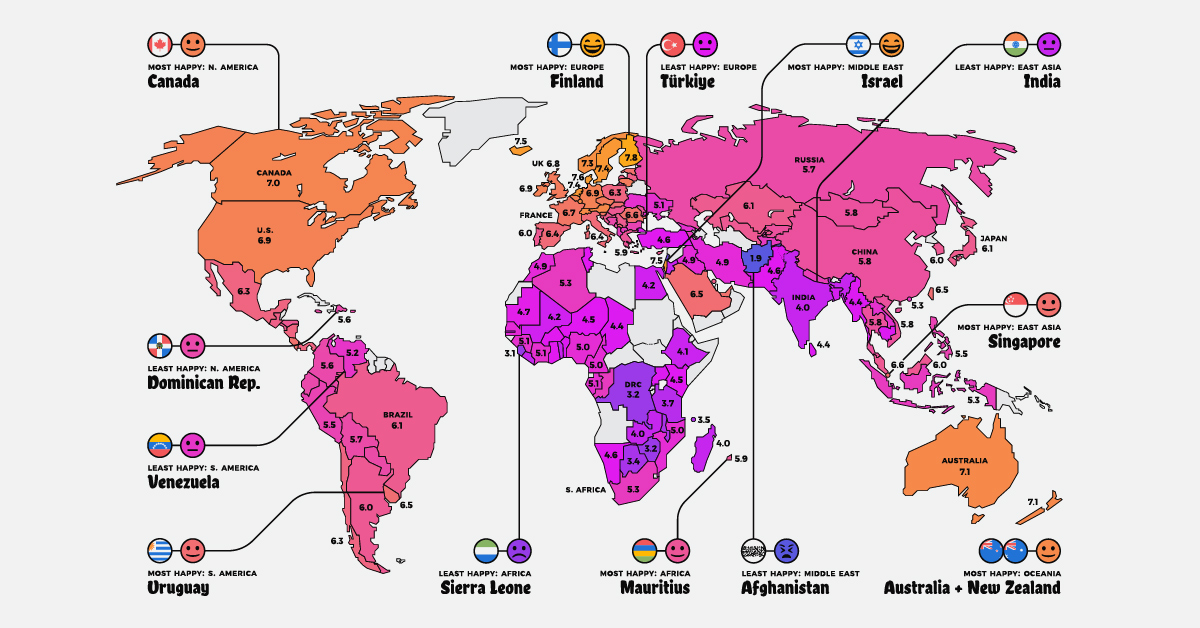
Though the above maps cover the five most populated countries on Earth, accounting for nearly half of the world’s population, they only show a small part of the global picture. As the full global density map at the top of the page highlights, the population patterns can accurately illustrate some geographic patterns and constraints, while others need further exploration. For example, the map clearly gives an outline of Africa and the sparse area that makes up the Sahara Desert. At the same time, landmasses like Australia and New Zealand are almost invisible save for a few clusters along the coast. To get a closer and more intricate picture of each country’s density map, head to Alasdair Rae’s long thread of rendered maps and start scrolling up to find yours! on Are wealth and prosperity legitimate measures of happiness? How about safety and health outcomes? In the West, we view democracy as a key component to happiness, yet there are countries under authoritarian rule that score high in the Happiness Index. Questions like these make “ranking happiness” a particularly challenging puzzle, but also one worth pursuing. If policymakers have a clearer picture of what conditions can foster happiness, they can enact policies that can improve the lives of people living their jurisdictions. The map above is a global snapshot of life satisfaction around the world. It utilizes the World Happiness Report—an annual survey of how satisfied citizens are worldwide—to map out the world’s happiest and least happy countries. To create the index the map is based on, researchers simply asked people how satisfied they are with their lives. Scores were assigned using these self-reported answers from people living within various countries, as well as quality of life factors. While there may be no perfect measure of happiness around the world, the report is a robust and transparent attempt to understand happiness at the global level. For more detailed notes on the report’s methodology and more, we recommend viewing the info box at the end of this article. Now, let’s look at the world’s happiest countries in 2023.
Global Happiness, by Country
Global happiness currently averages out to 5.5 out of 10, a decrease of 0.1 from last year. Below is a look at every country’s score: Note: Scores have been rounded to the first decimal place. European countries make up the bulk of the top 10, with Israel (#4) and New Zealand (#10) also making it into the top ranks. Finland sits at the very top of the ranking for the sixth year in a row. Now let’s look at the world’s happiest countries on a more regional basis.
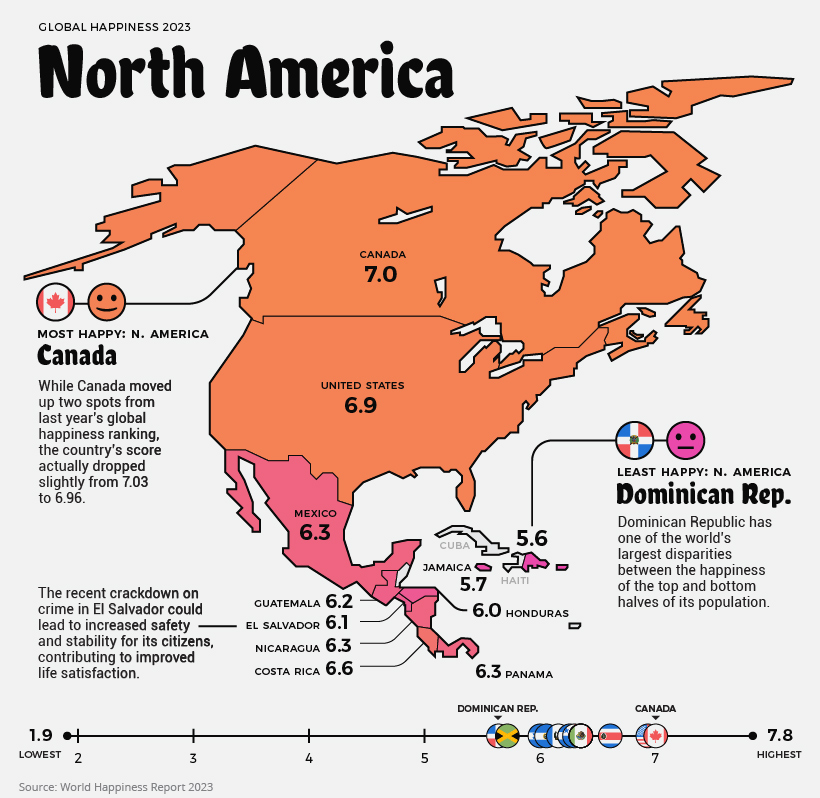
North America
Current Mood: Happy (6.3)
North America’s happiness score averages out to 6.3/10. The happiest country in the region is Canada, slightly beating out the United States. However, the scores of both countries have actually decreased from last year. It’s difficult to pinpoint why citizens feel less satisfied, but inflation, economic uncertainty, and many other factors could play a role. The only countries to see improvement in North America were Nicaragua and Jamaica. Although a more recent development, many Jamaicans could be experiencing even more happiness in the near future, with a recent announcement of plans to increase the minimum wage by 44%.
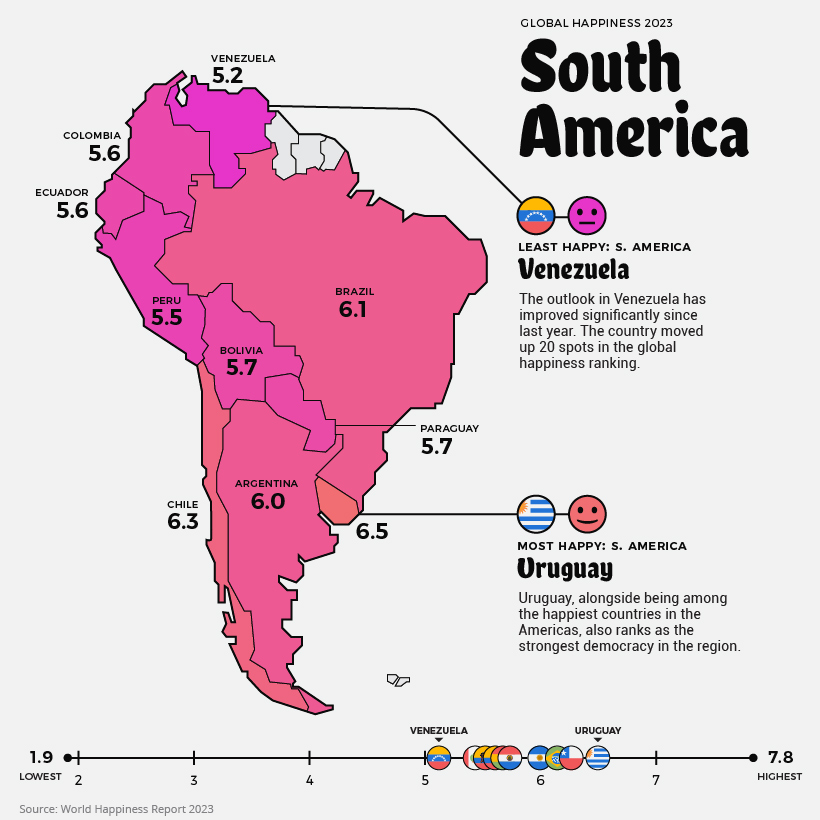
South America
Current Mood: Content (5.8)
South America’s average score is 5.8. Although Venezuela is the continent’s least happy country, its score actually improved from 4.9 to 5.2. That said, the ongoing humanitarian and economic crisis is not likely to instill much hope into the average Venezuelan. Over 6.8 million people have fled the struggling nation since 2014. The two countries in the region with decreased scores were Brazil and Colombia, where citizens have reported feeling worse compared to the year before.
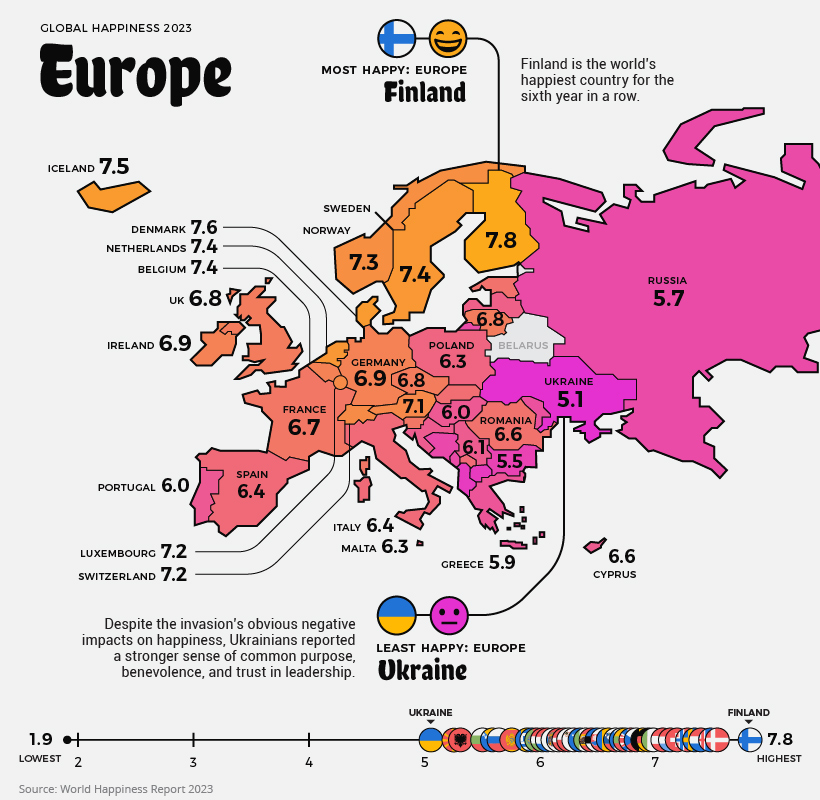
Europe
Current Mood: Happy (6.4)
Europe has some of the world’s happiest countries, with an average regional score of 6.4. Nordic countries like Finland, Sweden, and Iceland repeatedly report high scores, meaning people in these countries feel extremely satisfied with their lives.
Despite fending off an invasion, Ukrainians saw no diminishment of their happiness year-over-year, and many are feeling resilient and purposeful in their fight for freedom. Interestingly, Russia’s score actually increased slightly compared to last year, going from 5.5 to 5.7.
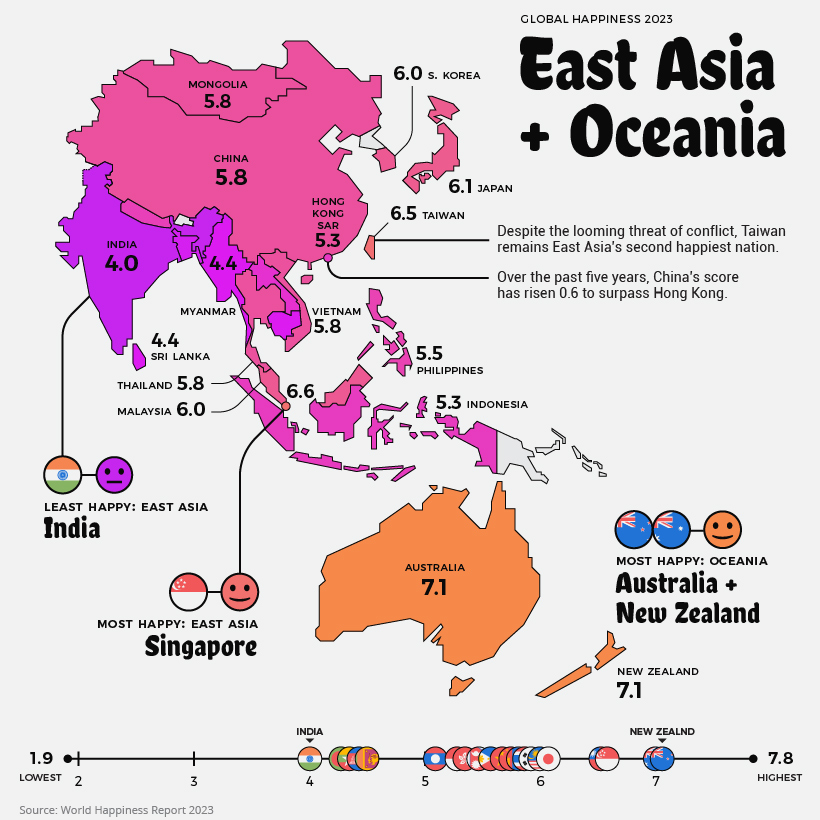
East Asia and Oceania
Current Mood: Neutral (5.6)
East Asia and Oceania’s collective average is 5.6. Oceania alone, however, would have the highest regional score in the world, at 7.1. Bucking conventional wisdom—at least in the West—China has seen a noteworthy bump (+0.6) in its score in recent years. Across the strait, Taiwan records the second highest score in East Asia, after Singapore. India once again has the lowest happiness score in its region. The country’s score has dropped -0.7 over the past decade.
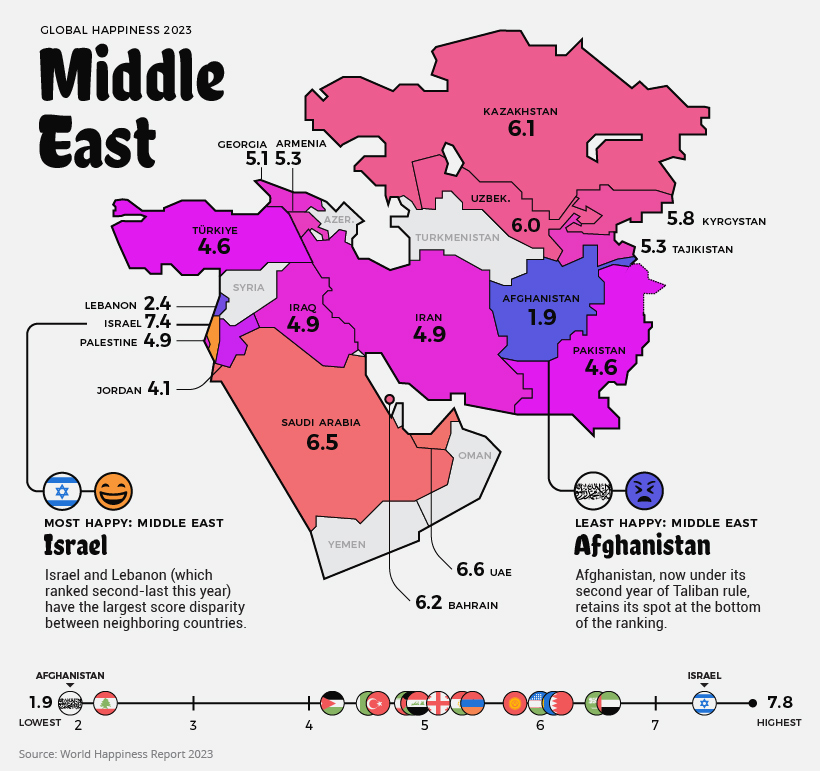
Central Asia and The Middle East
Current Mood: It’s Complicated (5.2)
The average score in the Middle East and Central Asia is 5.2, and the array of happiness scores is wider than in any other region. Afghanistan is the world’s least happy country, with citizens having reported extremely low levels of life satisfaction. Since the Taliban takeover, life has become objectively worse for Afghans, particularly women. There is a lot of conflict in the region. Citizens of Armenia face particular tension with neighboring Azerbaijan, whose score was not recorded for this year. Conflicts in the Nagorno-Karabakh region have led to hundreds of deaths since 2020 and cause daily struggle for those who live in the disputed territory. Iran is still under economic sanctions and faces ongoing tensions with the U.S. and Israel. Some countries, like Syria and Yemen, are so destabilized that no data is available. Still, there are bright spots as well. Israel has one of the world’s happiest countries with a top 10 score this year, and Saudi Arabia and the UAE have scores on par with many European countries.
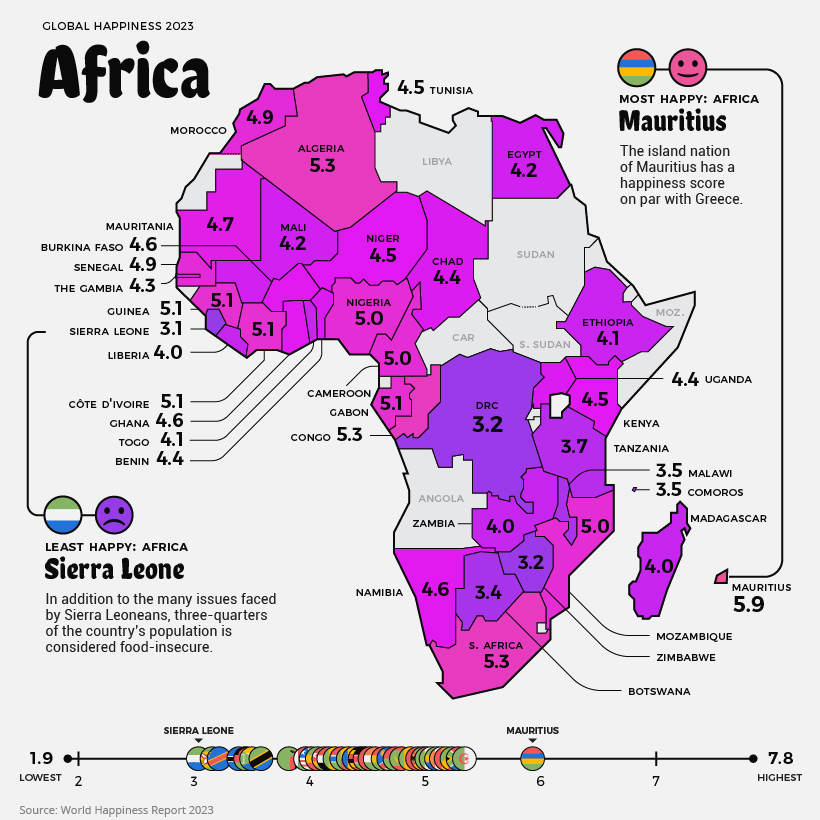
Africa
Current Mood: Unhappy (4.4)
The least happy region, Africa, averages out to a score of 4.4, and there is a lot of regional variation. The highest score in Africa goes to the island nation of Mauritius. In addition to the country’s natural beauty and stability, there is growing economic opportunity. Mauritius is classified as an upper-middle-income country by World Bank, and is one of the fastest growing high-income markets in the world. Sierra Leone has the lowest score of African countries that were included in the index, followed by Zimbabwe and the Democratic Republic of the Congo. It’s worth noting, there are a few data gaps in the region, including Burundi, which is currently the poorest country in the world. Source: The World Happiness Report which leverages data from the Gallup World Poll. Methodology: A nationally representative group of approximately 1,000 people is asked a series of questions relating to their life satisfaction, as well as positive and negative emotions they are experiencing. The life evaluation question is based on the Cantril ladder, wherein the top of the ladder represents the best possible life for a person (a score of 10/10) and on the flipside, the worst possible life (scored as 0/10). The main takeaway is that the scores result from self-reported answers by citizens of each of these countries. The results received a confidence interval of 95%, meaning that there is a 95% chance that the answers and population surveyed represent the average. As well, scores are averaged over the past three years in order to increase the sample size of respondents in each country. Criticisms: Critics of the World Happiness Report point out that survey questions measure satisfaction with socioeconomic conditions as opposed to individual emotional happiness. As well, there are myriad cultural differences around the world that influence how people think about happiness and life satisfaction. Finally, there can be big differences in life satisfaction between groups within a country, which are averaged out even in a nationally representative group. The report does acknowledge inequality as a factor by measuring the “gap” between the most and least happy halves of each country.