Today’s infographic uses extensive data from Equifax to try and answer this question. We put consumer debt in a historical context, while providing an in-depth look at the latest numbers on different categories of debt such as student loans, credit cards, and mortgages to see how they compare.
In the United States, there are three broad types of debt in the spectrum: government, corporate, and consumer debt. Government debt consists of federal, state, and municipal debt, and adds to a total of 136% of GDP. Meanwhile, corporate and consumer debt, which together constitute private debt, amount to 197% of GDP.
The History of Consumer Debt
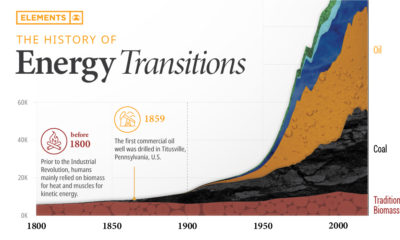
Before diving into the numbers, there are two historical developments worth mentioning that have greatly influenced consumer debt. The first is the rise of consumer credit through the 20th century. If you go back to the 1800s, it was a different place:
Information moved as fast as a boat. 90% of Americans lived in rural areas. 75% of Americans were involved with agricultural production. There was a stigma around borrowing to buy luxury items, and some saw it as immoral. Credit was only used in essential cases, such as borrowing money to buy seeds for farming. Credit history was oral and based on personal reputation.
Today is vastly different. Information travels instantaneously, the economy is diversified, computers are everywhere, and factories pump out cheap goods that people want to buy. Credit history is universal, and 72% of Americans have at least one credit card. For more information about the development of credit in the 20th century, check out this motion graphic video on the history of credit cards. The second factor that greatly influenced today’s consumer debt situation was government intervention in the mortgage markets between 1949 and 2000. Agencies such as the Federal Housing Administration (FHA), Ginnie Mae, Fannie Mae, and Freddie Mac were active with the following objectives:
Insuring mortgages Providing liquidity to the mortgage finance system Stabilizing the mortgage market Expanding the secondary market for mortgages
Between 1949 and 2000, home ownership increased from 54% to 64.7%. However, that coincided with increases in debt-to-income ratios (20% to 73%) and mortgage debt to household assets (15% to 41%).
The Composition of Consumer Debt
According to Equifax, U.S. consumer debt is at $12.44 trillion. Here’s how it breaks down:
Consumer Debt Trends
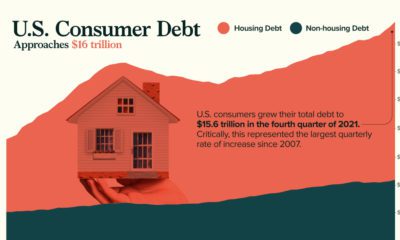
- Mortgage Debt Mortgage debt, by far the largest category of consumer debt, peaked during the 2008 Financial Crisis at close to $10 trillion. Today, however, it makes up 72% of total consumer debt at $8.96 trillion. This debt has been partially fueled by the lowest interest rates in history, which have put mortgage rates at all-time lows. Since 2010, mortgage defaults and delinquencies have both trended down back towards normal levels.
- Student Loans For the first time in history, consumers are more in debt to student loans than any other type of non-mortgage debt. The amount of student debt per person has steadily increased each year – especially for young people. For 18-25 year olds, student loan debt per person has increased from $4,637 in 2005 to $10,552 in 2015. The average young millennial now owes over 60% of of their non-mortgage debt to student loans. In total, Americans now have $1.3 trillion in student debt, spread between 44 million people.
- Credit Cards and Private Label Cards Credit card spending has been steadily increasing since the Financial Crisis, but it has not yet hit pre-crisis levels yet. As it stands, Americans have $665.8 billion in credit card debt spread between 391.9 million cards. Debt from private label cards, on the other hand, has surpassed pre-crisis levels. Private label cards are typically used to provide credit at department stores, furniture stores, and other retail locations. It is now at $77.4 billion, though this is relatively small compared to other credit card debt that exists.
- Auto Loans Total outstanding balances on auto loans and leases have increased 9.3% year-over-year to $1.14 trillion – putting it at all-time highs and making it the third largest consumer debt market overall. However, auto loan delinquencies have been generally trending down over recent years.
Putting it All Together
As far as non-mortgage debt goes, consumers have never been more indebted. However, mortgage debt is what really moves the needle for total debt numbers – and that is still not near levels seen during the Financial Crisis.
on The good news is that the Federal Reserve, U.S. Treasury, and Federal Deposit Insurance Corporation are taking action to restore confidence and take the appropriate measures to help provide stability in the market. With this in mind, the above infographic from New York Life Investments looks at the factors that impact bonds, how different types of bonds have historically performed across market environments, and the current bond market volatility in a broader context.
Bond Market Returns
Bonds had a historic year in 2022, posting one of the worst returns ever recorded. As interest rates rose at the fastest pace in 40 years, it pushed bond prices lower due to their inverse relationship. In a rare year, bonds dropped 13%.
Source: FactSet, 01/02/2023.
Bond prices are only one part of a bond’s total return—the other looks at the income a bond provides. As interest rates have increased in the last year, it has driven higher bond yields in 2023.
Source: YCharts, 3/20/2023.
With this recent performance in mind, let’s look at some other key factors that impact the bond market.
Factors Impacting Bond Markets
Interest rates play a central role in bond market dynamics. This is because they affect a bond’s price. When rates are rising, existing bonds with lower rates are less valuable and prices decline. When rates are dropping, existing bonds with higher rates are more valuable and their prices rise. In March, the Federal Reserve raised rates 25 basis points to fall within the 4.75%-5.00% range, a level not seen since September 2007. Here are projections for where the federal funds rate is headed in 2023:
Federal Reserve Projection*: 5.1% Economist Projections**: 5.3%
*Based on median estimates in the March summary of quarterly economic projections.**Projections based on March 10-15 Bloomberg economist survey. Together, interest rates and the macroenvironment can have a positive or negative effect on bonds.
Positive
Here are three variables that may affect bond prices in a positive direction:
Lower Inflation: Reduces likelihood of interest rate hikes. Lower Interest Rates: When rates are falling, bond prices are typically higher. Recession: Can prompt a cut in interest rates, boosting bond prices.
Negative
On the other hand, here are variables that may negatively impact bond prices:
Higher Inflation: Can increase the likelihood of the Federal Reserve to raise interest rates. Rising Interest Rates: Interest rate hikes lead bond prices to fall. Weaker Fundamentals: When a bond’s credit risk gets worse, its price can drop. Credit risk indicates the chance of a default, the risk of a bond issuer not making interest payments within a given time period.
Bonds have been impacted by these negative factors since inflation started rising in March 2021.
Fixed Income Opportunities
Below, we show the types of bonds that have had the best performance during rising rates and recessions.
Source: Derek Horstmeyer, George Mason University 12/3/2022. As we can see, U.S. ultrashort bonds performed the best during rising rates. Mortgage bonds outperformed during recessions, averaging 11.4% returns, but with higher volatility. U.S. long-term bonds had 7.7% average returns, the best across all market conditions. In fact, they were also a close second during recessions. When rates are rising, ultrashort bonds allow investors to capture higher rates when they mature, often with lower historical volatility.
A Closer Look at Bond Market Volatility
While bond market volatility has jumped this year, current dislocations may provide investment opportunities. Bond dislocations allow investors to buy at lower prices, factoring in that the fundamental quality of the bond remains strong. With this in mind, here are two areas of the bond market that may provide opportunities for investors:
Investment-Grade Corporate Bonds: Higher credit quality makes them potentially less vulnerable to increasing interest rates. Intermediate Bonds (2-10 Years): Allow investors to lock in higher rates.
Both types of bonds focus on quality and capturing higher yields when faced with challenging market conditions.
Finding the Upside
Much of the volatility seen in the banking sector was due to banks buying bonds during the pandemic—or even earlier—at a time when interest rates were historically low. Since then, rates have climbed considerably. Should rates moderate or stop increasing, this may present better market conditions for bonds. In this way, today’s steep discount in bond markets may present an attractive opportunity for price appreciation. At the same time, investors can potentially lock in strong yields as inflation may subside in the coming years ahead. Learn more about bond investing strategies with New York Life Investments.