However, the insatiable desire for consumers to own nice things was suddenly interrupted by the coming of COVID-19, and experts are predicting a brutal contraction of up to one-third of the current luxury good market size this year. Will the industry bounce back? Or will it return as something noticeably different?
A Once Promising Trajectory
The global luxury goods market—which includes beauty, apparel, and accessories—has compounded at a 6% pace since the 1990s. Recent years of growth in the personal luxury goods market can be mostly attributed to Chinese consumers. This geographic market accounted for 90% of total sales growth in 2019, followed by the Europe and the Americas. Analysts suggest that China’s younger luxury goods consumers in particular have significant spending power, with an average spend of $6,000 (¥41,000) per person in pre-COVID times.
An Industry Now in Distress
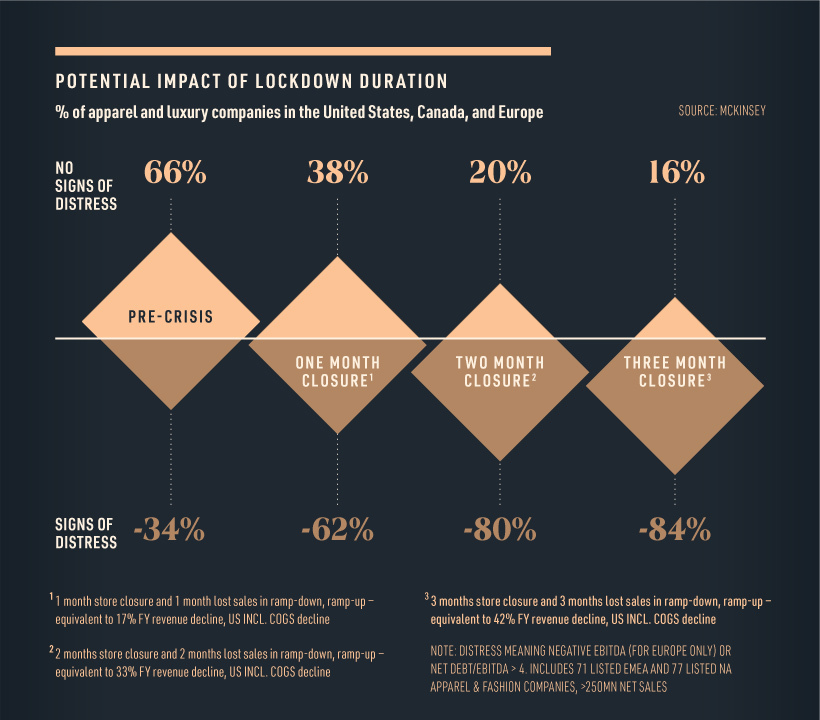
The lethal combination of reduced foot traffic and decreased consumer spending in the first quarter of 2020 has brought the retail industry to its knees. In fact, more than 80% of fashion and luxury players will experience financial distress as a result of extended store closures.
With iconic luxury retailers such as Neiman Marcus filing for bankruptcy, the pressure on the luxury industry is clear. It should be noted however, that companies who were experiencing distress before the COVID-19 outbreak will be the hardest hit.
Predicting the Collapse
In a recent report, Bain & Company estimated a 25% to 30% global luxury market contraction for the first quarter of 2020 based on several economic variables. They have also modeled three scenarios to predict the performance for the remainder of 2020.
Optimistic scenario: A limited market contraction of 15% to 18%, assuming increased consumer demand for the second and third quarter of the year, roughly equating to a sales decline of $46 billion to $56 billion. Intermediate scenario: A moderate market contraction of between 22% and 25%, or $68 to $77 billion. Worst-case scenario: A steep contraction of between 30% and 35%, equating to $92 billion to $108 billion. This assumes a longer period of sales decline.
Although there are signs of recovery in China, the industry is not expected to fully return to 2019 levels until 2022 at the earliest. By that stage, the industry could have transformed entirely.
Changing Consumer Mindsets
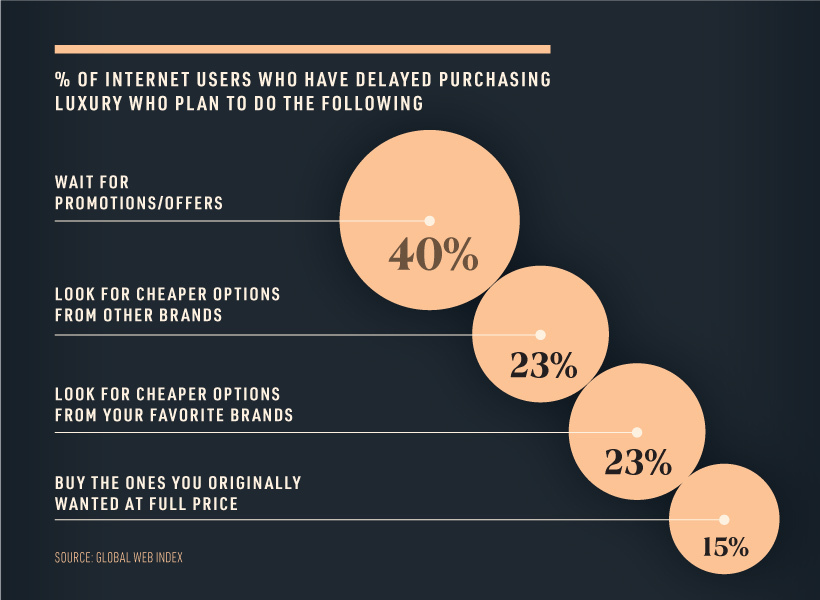
Since the beginning of the pandemic, one-quarter of consumers have delayed purchasing luxury items. In fact, a portion of those who have delayed purchasing luxury goods are now considering entirely new avenues, such as seeking out cheaper alternatives. However, most people surveyed claim that they will postpone buying luxury items until they can get a better deal on price.
This frugal mindset could spark an interesting behavioral shift, and set the stage for a new category to emerge from the ashes—the second-hand luxury market. Numerous sources claim that pre-owned luxury could in fact overtake the traditional luxury market, and the pandemic economy could very well be a tipping point.
The Future of Luxury
Medium-term market growth could be driven by a number of factors, from a global growing middle class and their demand for luxury products, as well as retailers’ sudden shift to e-commerce. While analysts can only rely on predictions to determine the future of personal luxury, it is clear that the industry is at a crossroads. on Last year, stock and bond returns tumbled after the Federal Reserve hiked interest rates at the fastest speed in 40 years. It was the first time in decades that both asset classes posted negative annual investment returns in tandem. Over four decades, this has happened 2.4% of the time across any 12-month rolling period. To look at how various stock and bond asset allocations have performed over history—and their broader correlations—the above graphic charts their best, worst, and average returns, using data from Vanguard.
How Has Asset Allocation Impacted Returns?
Based on data between 1926 and 2019, the table below looks at the spectrum of market returns of different asset allocations:
We can see that a portfolio made entirely of stocks returned 10.3% on average, the highest across all asset allocations. Of course, this came with wider return variance, hitting an annual low of -43% and a high of 54%.
A traditional 60/40 portfolio—which has lost its luster in recent years as low interest rates have led to lower bond returns—saw an average historical return of 8.8%. As interest rates have climbed in recent years, this may widen its appeal once again as bond returns may rise.
Meanwhile, a 100% bond portfolio averaged 5.3% in annual returns over the period. Bonds typically serve as a hedge against portfolio losses thanks to their typically negative historical correlation to stocks.
A Closer Look at Historical Correlations
To understand how 2022 was an outlier in terms of asset correlations we can look at the graphic below:
The last time stocks and bonds moved together in a negative direction was in 1969. At the time, inflation was accelerating and the Fed was hiking interest rates to cool rising costs. In fact, historically, when inflation surges, stocks and bonds have often moved in similar directions. Underscoring this divergence is real interest rate volatility. When real interest rates are a driving force in the market, as we have seen in the last year, it hurts both stock and bond returns. This is because higher interest rates can reduce the future cash flows of these investments. Adding another layer is the level of risk appetite among investors. When the economic outlook is uncertain and interest rate volatility is high, investors are more likely to take risk off their portfolios and demand higher returns for taking on higher risk. This can push down equity and bond prices. On the other hand, if the economic outlook is positive, investors may be willing to take on more risk, in turn potentially boosting equity prices.
Current Investment Returns in Context
Today, financial markets are seeing sharp swings as the ripple effects of higher interest rates are sinking in. For investors, historical data provides insight on long-term asset allocation trends. Over the last century, cycles of high interest rates have come and gone. Both equity and bond investment returns have been resilient for investors who stay the course.