As our aging population nears retirement and gets closer to cashing in their pensions, countries need to ensure their pension systems can withstand the extra strain. This graphic uses data from the Melbourne Mercer Global Pension Index (MMGPI) to showcase which countries are best equipped to support their older citizens, and which ones aren’t.
The Breakdown
Each country’s pension system has been shaped by its own economic and historical context. This makes it difficult to draw precise comparisons between countries—yet there are certain universal elements that typically lead to adequate and stable support for older citizens. MMGPI organized these universal elements into three sub-indexes:
Adequacy: The base-level of income, as well as the design of a region’s private pension system. Sustainability: The state pension age, the level of advanced funding from government, and the level of government debt. Integrity: Regulations and governance put in place to protect plan members.
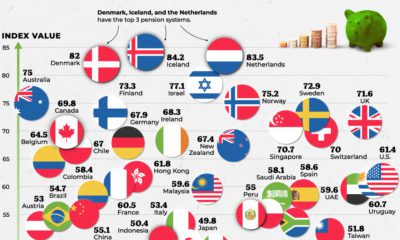
These three measures were used to rank the pension system of 37 different countries, representing over 63% of the world’s population. Here’s how each country ranked:
The Importance of Sustainability
While all three sub-indexes are important to consider when ranking a country’s pension system, sustainability is particularly significant in the modern context. This is because our global population is increasingly skewing older, meaning an influx of people will soon be cashing in their retirement funds. As a consequence, countries need to ensure their pension systems are sustainable over the long-term. There are several factors that affect a pension system’s sustainability, including a region’s private pension system, the state pension age, and the balance between workers and retirees. The country with the most sustainable pension system is Denmark. Not only does the country have a strong basic pension plan—it also has a mandatory occupational scheme, which means employers are obligated by law to provide pension plans for their employees.
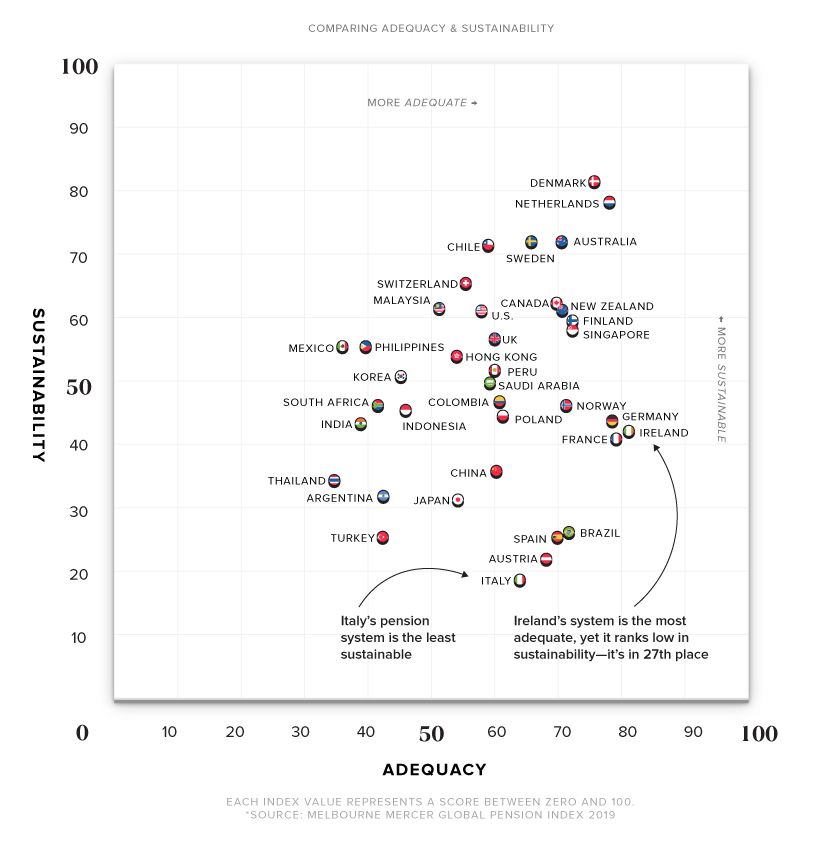
Adequacy versus Sustainability
Several countries scored high on adequacy but ranked low when it came to sustainability. Here’s a comparison of both measures, and how each country scored:
Ireland took first place for adequacy, but scored relatively low on the sustainability front at 27th place. This can be partly explained by Ireland’s low level of occupational coverage. The country also has a rapidly aging population, which skews the ratio of workers to retirees. By 2050, Ireland’s worker to retiree ratio is estimated to go from 5:1 to 2:1. Similar to Ireland, Spain ranks high in adequacy but places extremely low in sustainability. There are several possible explanations for this—while occupational pension schemes exist, they are optional and participation is low. Spain also has a low fertility rate, which means their worker-to-retiree ratio is expected to decrease.
Steps Towards a Better System
All countries have room for improvement—even the highest-ranking ones. Some general recommendations from MMGPI on how to build a better pension system include:
Increasing the age of retirement: Helps maintain a more balanced worker-to-retiree ratio. Enforcing mandatory occupational schemes: Makes employers obligated to provide pension plans for their employees. Limiting access to benefits: Prevents people from dipping into their savings preemptively, thus preserving funds until retirement. Establishing strong pension assets to fund future liabilities: Ideally, these assets are more than 100% of a country’s GDP. Pension systems across the globe are under an increasing amount of pressure. It’s time for countries to take a hard look at their pension systems to make sure they’re ready to support their aging population.
on Last year, stock and bond returns tumbled after the Federal Reserve hiked interest rates at the fastest speed in 40 years. It was the first time in decades that both asset classes posted negative annual investment returns in tandem. Over four decades, this has happened 2.4% of the time across any 12-month rolling period. To look at how various stock and bond asset allocations have performed over history—and their broader correlations—the above graphic charts their best, worst, and average returns, using data from Vanguard.
How Has Asset Allocation Impacted Returns?
Based on data between 1926 and 2019, the table below looks at the spectrum of market returns of different asset allocations:
We can see that a portfolio made entirely of stocks returned 10.3% on average, the highest across all asset allocations. Of course, this came with wider return variance, hitting an annual low of -43% and a high of 54%.
A traditional 60/40 portfolio—which has lost its luster in recent years as low interest rates have led to lower bond returns—saw an average historical return of 8.8%. As interest rates have climbed in recent years, this may widen its appeal once again as bond returns may rise.
Meanwhile, a 100% bond portfolio averaged 5.3% in annual returns over the period. Bonds typically serve as a hedge against portfolio losses thanks to their typically negative historical correlation to stocks.
A Closer Look at Historical Correlations
To understand how 2022 was an outlier in terms of asset correlations we can look at the graphic below:
The last time stocks and bonds moved together in a negative direction was in 1969. At the time, inflation was accelerating and the Fed was hiking interest rates to cool rising costs. In fact, historically, when inflation surges, stocks and bonds have often moved in similar directions. Underscoring this divergence is real interest rate volatility. When real interest rates are a driving force in the market, as we have seen in the last year, it hurts both stock and bond returns. This is because higher interest rates can reduce the future cash flows of these investments. Adding another layer is the level of risk appetite among investors. When the economic outlook is uncertain and interest rate volatility is high, investors are more likely to take risk off their portfolios and demand higher returns for taking on higher risk. This can push down equity and bond prices. On the other hand, if the economic outlook is positive, investors may be willing to take on more risk, in turn potentially boosting equity prices.
Current Investment Returns in Context
Today, financial markets are seeing sharp swings as the ripple effects of higher interest rates are sinking in. For investors, historical data provides insight on long-term asset allocation trends. Over the last century, cycles of high interest rates have come and gone. Both equity and bond investment returns have been resilient for investors who stay the course.