Just under one billion people still lack basic access to electricity, and many more connect to the grid through improvised wiring or live through frequent blackouts. On the flip side of the socioeconomic spectrum, a growing chorus of voices is pressuring governments and corporations to power the global economy in a more sustainable way. Today’s visualization – using data from the World Energy Council (WEC) – ranks countries based on their mix of policies for tackling issues like energy security and environmental sustainability.
The Energy Trilemma Index
According to WEC, there are three primary policy areas that form the “trilemma”:
- Energy Security A nation’s capacity to meet current and future energy demand reliably, and bounce back swiftly from system shocks with minimal disruption to supply. This dimension covers the effectiveness of management of domestic and external energy sources, as well as the reliability and resilience of energy infrastructure.
- Energy Equity A country’s ability to provide universal access to reliable, affordable, and abundant energy for domestic and commercial use. This dimension captures basic access to electricity and clean cooking fuels and technologies, access to prosperity-enabling levels of energy consumption, and affordability of electricity, gas, and fuel.
- Environmental Sustainability The transition of a country’s energy system towards mitigating and avoiding environmental harm and climate change impacts. This dimension focuses on productivity and efficiency of generation, transmission and distribution, decarbonization, and air quality. Using the dimensions above, a score out of 100 is generated. Here’s a complete ranking that shows which countries have the most sustainable energy policies:
Highs, Lows, and Outliers
Every country has unique circumstances — from strategic energy reserves to green energy ambitions — that shape their domestic energy policies. Let’s take a closer look at some of the more interesting situations around the world.
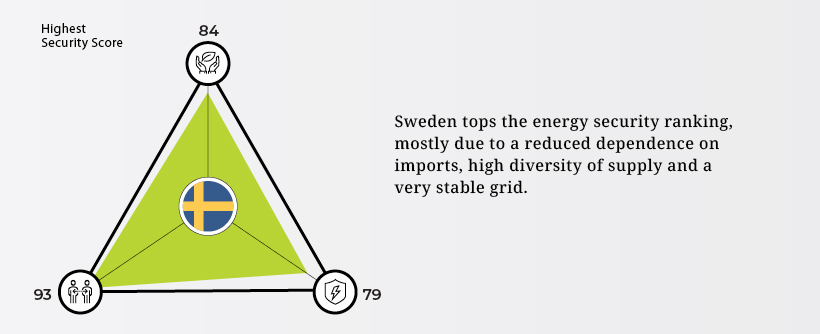
Sweden
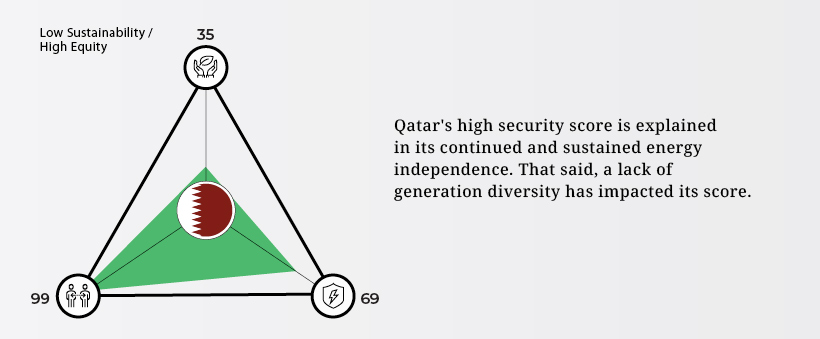
Qatar
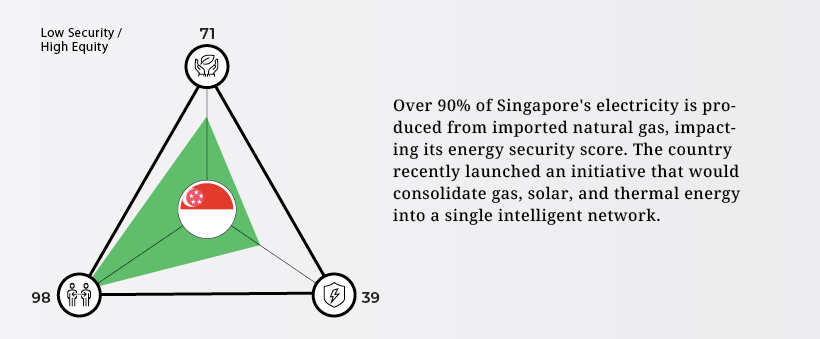
Singapore
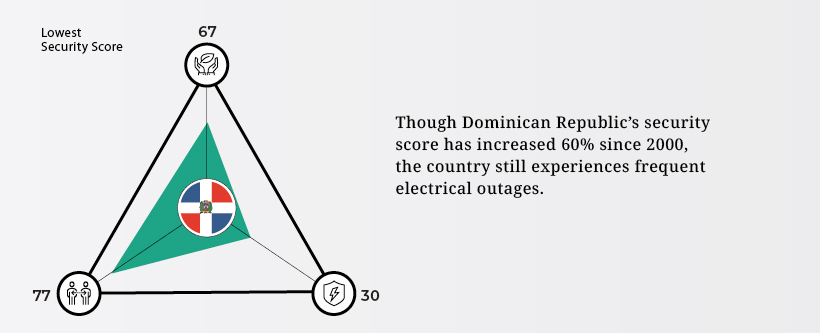
Dominican Republic
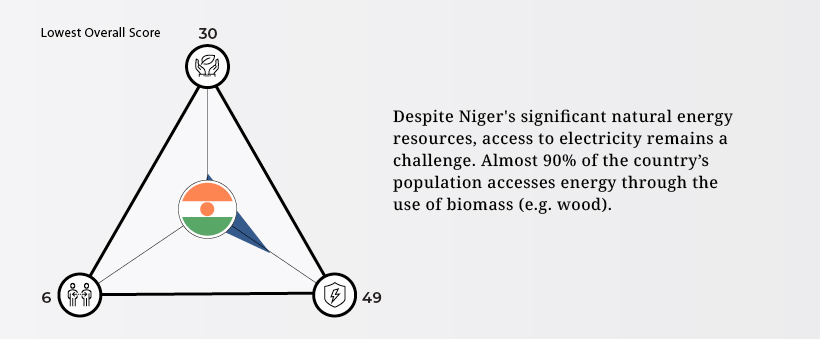
Niger
Global Energy Outlook
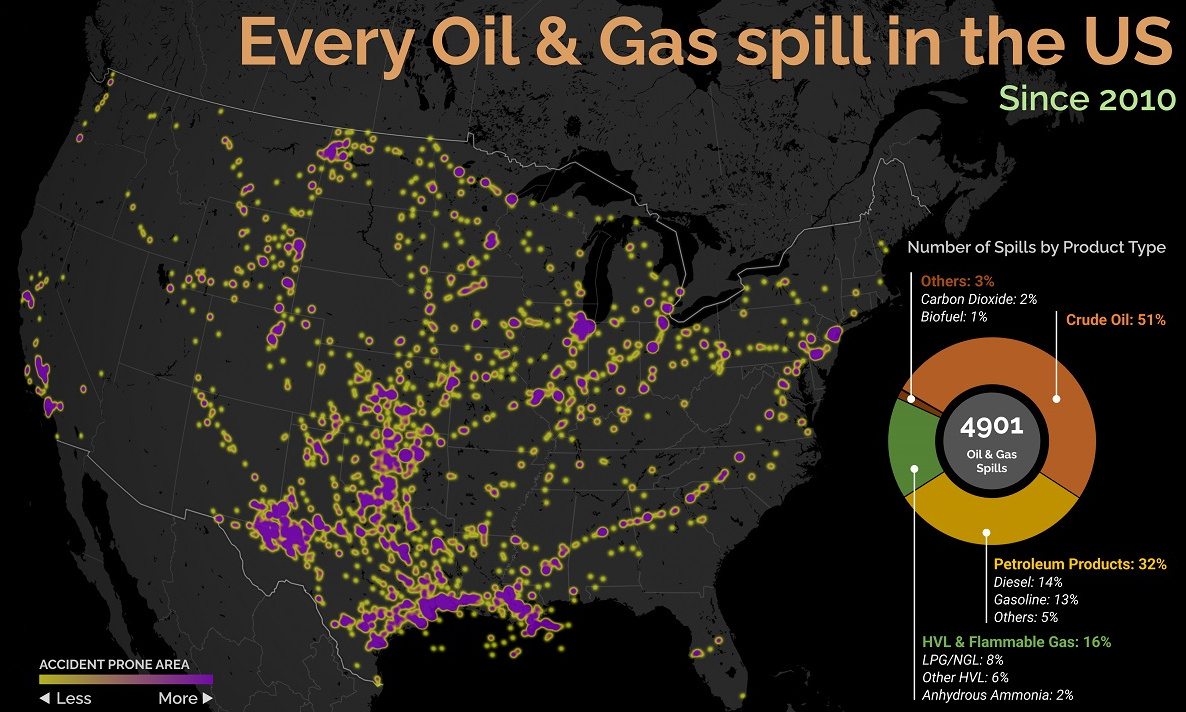
Achieving the balance of prosperity and sustainability is a goal of nearly every country, but it takes stability and the right mix of policies to get the job done. The fact that many trilemma scores are improving is an indicator that the world’s patchwork of energy policies are slowly moving in the right direction. on Aside from the obvious climate impact they bring, one other downside in particular is spills, which can lead to ecological and economic damage. These can happen due to pipeline leaks, train derailments, or other industrial disasters. This graphic from Preyash Shah provides a visual overview of every oil and gas spill in the contiguous U.S. since 2010. Data is tracked by the U.S. government’s Pipeline and Hazardous Materials Safety Administration (PHMSA).
U.S. Oil and Gas Spills (2010‒2022)
The majority of spills that have occurred come mostly from crude oil, followed by petroleum products and gas. Note that this data covers the quantity of spills and not damages or volume.
Crude oil, which makes up just over half of documented spills, is also one of the most costly. Contaminations can persist for years after a spill, and its impact on local mammals and waterfowl is particularly harsh. This has been the case with the Deepwater Horizon spill (also known as the “BP oil spill”), which experts say is still causing harm in the Gulf of Mexico. Other products with lots of spills include petroleum products such as diesel or gasoline, as well as liquefied natural gas or other volatile liquids. Interestingly, liquefied carbon dioxide can also be transported in pipelines, commonly used for carbon capture storage, but requires high pressure to maintain its state. When looking at the location of spills, it’s clear that the South Central states have experienced the highest number of disasters. In contrast, the West Coast has had substantially less activity. However, this makes much more sense when looking at the dominant oil producing states, where Texas and surrounding neighbors reign supreme. Of the 4,901 spills during this period, Texas accounts for 1,936 or roughly 40% of all oil and gas spills. This is followed by Oklahoma, which has had 407 spills and is one of the largest net exporters of oil and gas in the country.
What Causes Spills?
Oil and gas spills actually have a surprisingly long history, with one of the earliest dating back to 1889, when a spill was reported on the coast between Los Angeles and San Diego. Causes have consisted primarily of weather, natural disasters, equipment and technological malfunction, as well as human error. However, they only became a widespread problem around the halfway mark of the 20th century, when petroleum extraction and production really began to take off. This era also saw the emergence of supertankers, which can transport half a million tons of oil but therefore make the risk of spills even costlier. In fact, the biggest spill off U.S. waters after the Deepwater Horizon disaster is the 1989 Exxon Valdez spill in Alaska, when a tanker crashed into a reef and 11 million gallons of oil spilled into the Pacific Ocean.