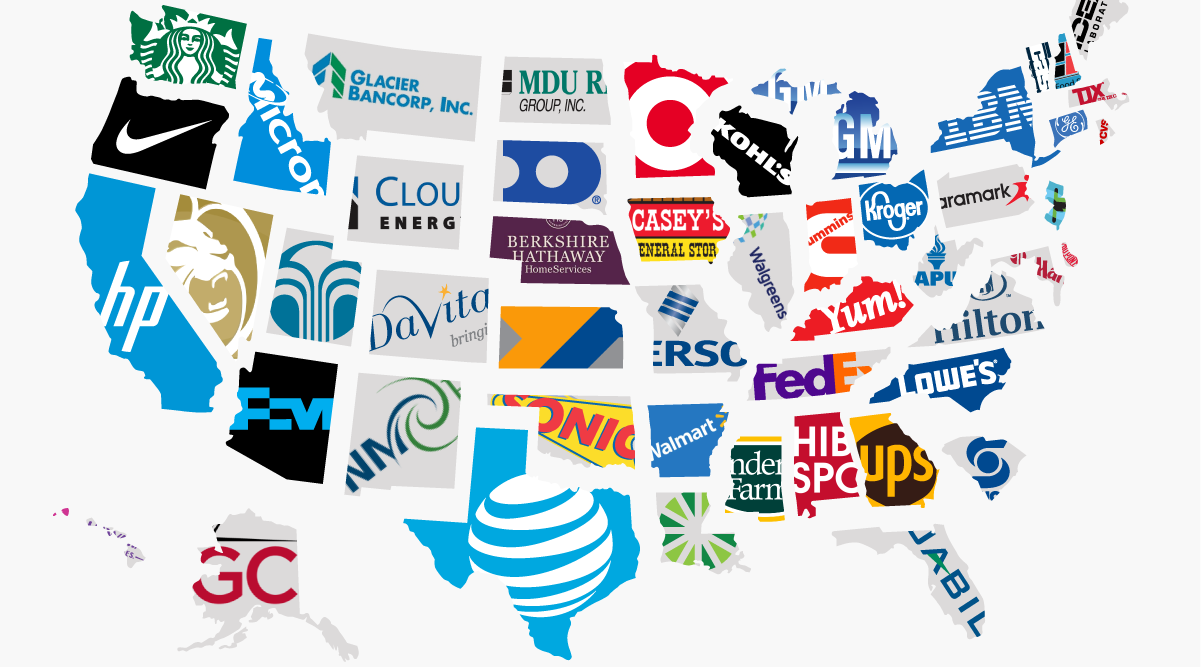
Employees Versus Revenue
In order to be considered one of the largest corporations in America, a company needs to have thousands of employees and billions in revenue. Yet, while it may be intuitive to expect the top companies to be leaders in terms of both revenue and headcount, it’s actually much less common than one would think. Compare the above list based on number of employees to our previous post on the largest company in each state by revenue to see the very limited overlap. Nike (Oregon), GE (Connecticut), GM (Michigan), and Berkshire Hathaway (Nebraska) are some of the rare examples of companies being #1 in both categories. However, the list of counterexamples is even longer. Here are some of the more interesting ones:
Starbucks, based in Washington State, has the most employees, but Costco reigns supreme in terms of revenue. In New York, IBM has the biggest headcount, but Verizon tops Big Blue with about $40 billion more revenue each year. HP is California’s leader by total employees, but Chevron takes top spot for revenue. Lowe’s beats Bank of America in North Carolina in terms of the number of employees, but not revenue. Exxon Mobil (Texas) is one of the world’s largest corporations in terms of revenue and market capitalization. Dallas-based AT&T has more employees, though. In New Jersey, Cognizant Technology Solutions is the biggest company by employees – but it can’t compete with Johnson & Johnson for revenue.
It’s tempting to generalize that more retail and service-focused brands like Starbucks and Lowe’s will always have a higher ratio of employees-to-revenue than companies in energy, technology, or financial sectors. It appears that is not necessarily true, though. Consider IBM and Verizon, which are both based in New York, as an example. Verizon is the bigger company in terms of revenues and market capitalization, but it has less than half the amount of employees of IBM. This is even despite 2,330 retail locations for Verizon Wireless, and owning labor-intensive mass media businesses through its AOL and Yahoo subsidiaries. on The good news is that the Federal Reserve, U.S. Treasury, and Federal Deposit Insurance Corporation are taking action to restore confidence and take the appropriate measures to help provide stability in the market. With this in mind, the above infographic from New York Life Investments looks at the factors that impact bonds, how different types of bonds have historically performed across market environments, and the current bond market volatility in a broader context.
Bond Market Returns
Bonds had a historic year in 2022, posting one of the worst returns ever recorded. As interest rates rose at the fastest pace in 40 years, it pushed bond prices lower due to their inverse relationship. In a rare year, bonds dropped 13%.
Source: FactSet, 01/02/2023.
Bond prices are only one part of a bond’s total return—the other looks at the income a bond provides. As interest rates have increased in the last year, it has driven higher bond yields in 2023.
Source: YCharts, 3/20/2023.
With this recent performance in mind, let’s look at some other key factors that impact the bond market.
Factors Impacting Bond Markets
Interest rates play a central role in bond market dynamics. This is because they affect a bond’s price. When rates are rising, existing bonds with lower rates are less valuable and prices decline. When rates are dropping, existing bonds with higher rates are more valuable and their prices rise. In March, the Federal Reserve raised rates 25 basis points to fall within the 4.75%-5.00% range, a level not seen since September 2007. Here are projections for where the federal funds rate is headed in 2023:
Federal Reserve Projection*: 5.1% Economist Projections**: 5.3%
*Based on median estimates in the March summary of quarterly economic projections.**Projections based on March 10-15 Bloomberg economist survey. Together, interest rates and the macroenvironment can have a positive or negative effect on bonds.
Positive
Here are three variables that may affect bond prices in a positive direction:
Lower Inflation: Reduces likelihood of interest rate hikes. Lower Interest Rates: When rates are falling, bond prices are typically higher. Recession: Can prompt a cut in interest rates, boosting bond prices.
Negative
On the other hand, here are variables that may negatively impact bond prices:
Higher Inflation: Can increase the likelihood of the Federal Reserve to raise interest rates. Rising Interest Rates: Interest rate hikes lead bond prices to fall. Weaker Fundamentals: When a bond’s credit risk gets worse, its price can drop. Credit risk indicates the chance of a default, the risk of a bond issuer not making interest payments within a given time period.
Bonds have been impacted by these negative factors since inflation started rising in March 2021.
Fixed Income Opportunities
Below, we show the types of bonds that have had the best performance during rising rates and recessions.
Source: Derek Horstmeyer, George Mason University 12/3/2022. As we can see, U.S. ultrashort bonds performed the best during rising rates. Mortgage bonds outperformed during recessions, averaging 11.4% returns, but with higher volatility. U.S. long-term bonds had 7.7% average returns, the best across all market conditions. In fact, they were also a close second during recessions. When rates are rising, ultrashort bonds allow investors to capture higher rates when they mature, often with lower historical volatility.
A Closer Look at Bond Market Volatility
While bond market volatility has jumped this year, current dislocations may provide investment opportunities. Bond dislocations allow investors to buy at lower prices, factoring in that the fundamental quality of the bond remains strong. With this in mind, here are two areas of the bond market that may provide opportunities for investors:
Investment-Grade Corporate Bonds: Higher credit quality makes them potentially less vulnerable to increasing interest rates. Intermediate Bonds (2-10 Years): Allow investors to lock in higher rates.
Both types of bonds focus on quality and capturing higher yields when faced with challenging market conditions.
Finding the Upside
Much of the volatility seen in the banking sector was due to banks buying bonds during the pandemic—or even earlier—at a time when interest rates were historically low. Since then, rates have climbed considerably. Should rates moderate or stop increasing, this may present better market conditions for bonds. In this way, today’s steep discount in bond markets may present an attractive opportunity for price appreciation. At the same time, investors can potentially lock in strong yields as inflation may subside in the coming years ahead. Learn more about bond investing strategies with New York Life Investments.