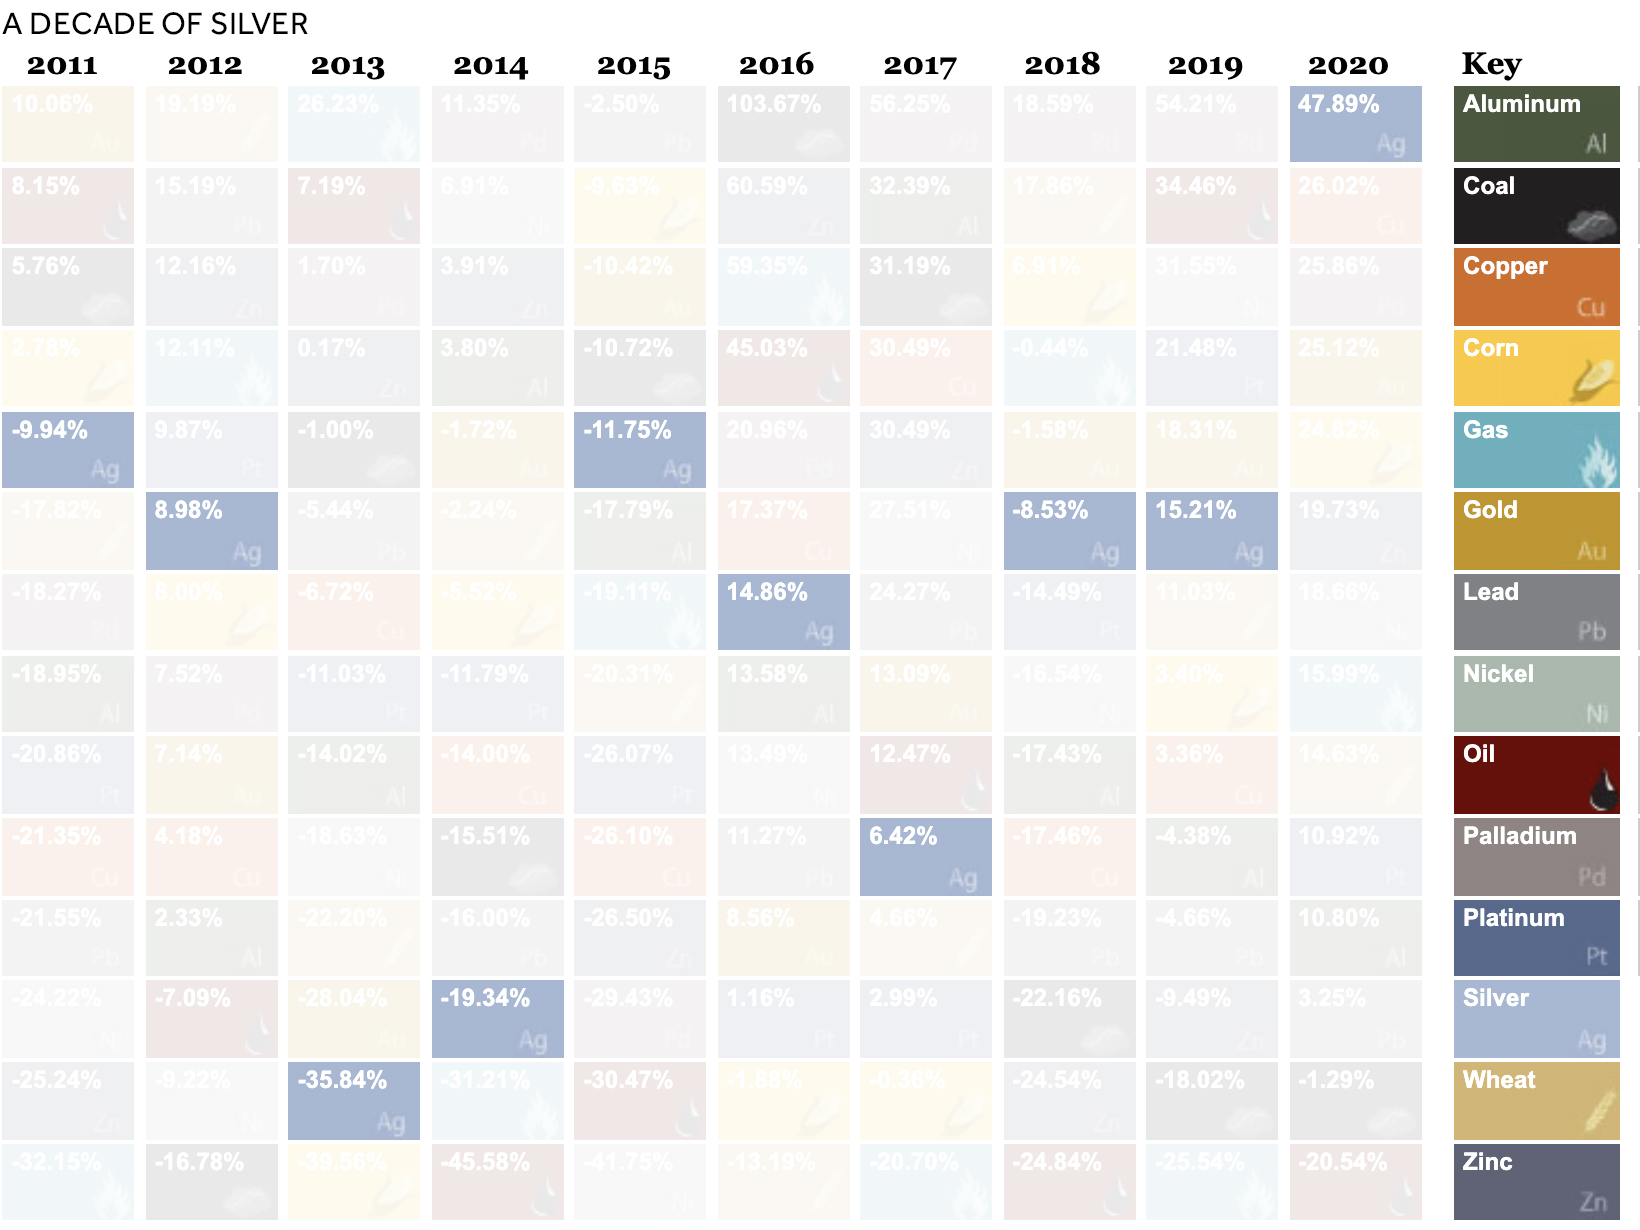
Take silver. Typically known for sharp, idiosyncratic price movements, it faced double-digit declines in the first half of the decade, falling over 35% in just 2013 alone. By contrast, it jumped over 47% in 2020. Similarly, oil, corn, and others witnessed either steep declines or rapid gains. The above graphic from U.S. Global Investors traces 10 years of commodity price performance, highlighting 14 different commodities and their annual ranking over the years.
Commodity Price Performance, From Best to Worst
Which commodities were the top performers in 2020? The aforementioned silver tripled its returns year-over-year, climbing 47.9% in 2020. In July, the metal actually experienced its strongest month since 1979. Along with silver, at least seven other commodities had stronger returns than the S&P 500 in 2020, which closed off the year with 16.3% gains. This included copper (26.0%), palladium (25.9%), gold (25.1%) and corn (24.8%). Interestingly, copper prices moved in an unconventional pattern compared to gold in 2020. Often, investors rush to gold in uncertain economic climates, while sectors such as construction and manufacturing—which both rely heavily on copper—tend to decline. Instead, both copper and gold saw their prices rise in conjunction. Nowadays, copper is also a vital material in electric vehicles (EVs), with recent demand for EVs also influencing the price of copper.
Silver Linings
As investors flocked to safety, silver’s price reached heights not seen since 2010. The massive scale of monetary and fiscal stimulus led to inflationary fears, also boosting the price of silver. How does this compare to its returns over the last decade?
In 2013, silver crashed over 35% as confidence grew in global markets. By contrast, in 2016, the Brexit referendum stirred uncertainty in global markets. Investors allocated money in silver, and prices shifted upwards.
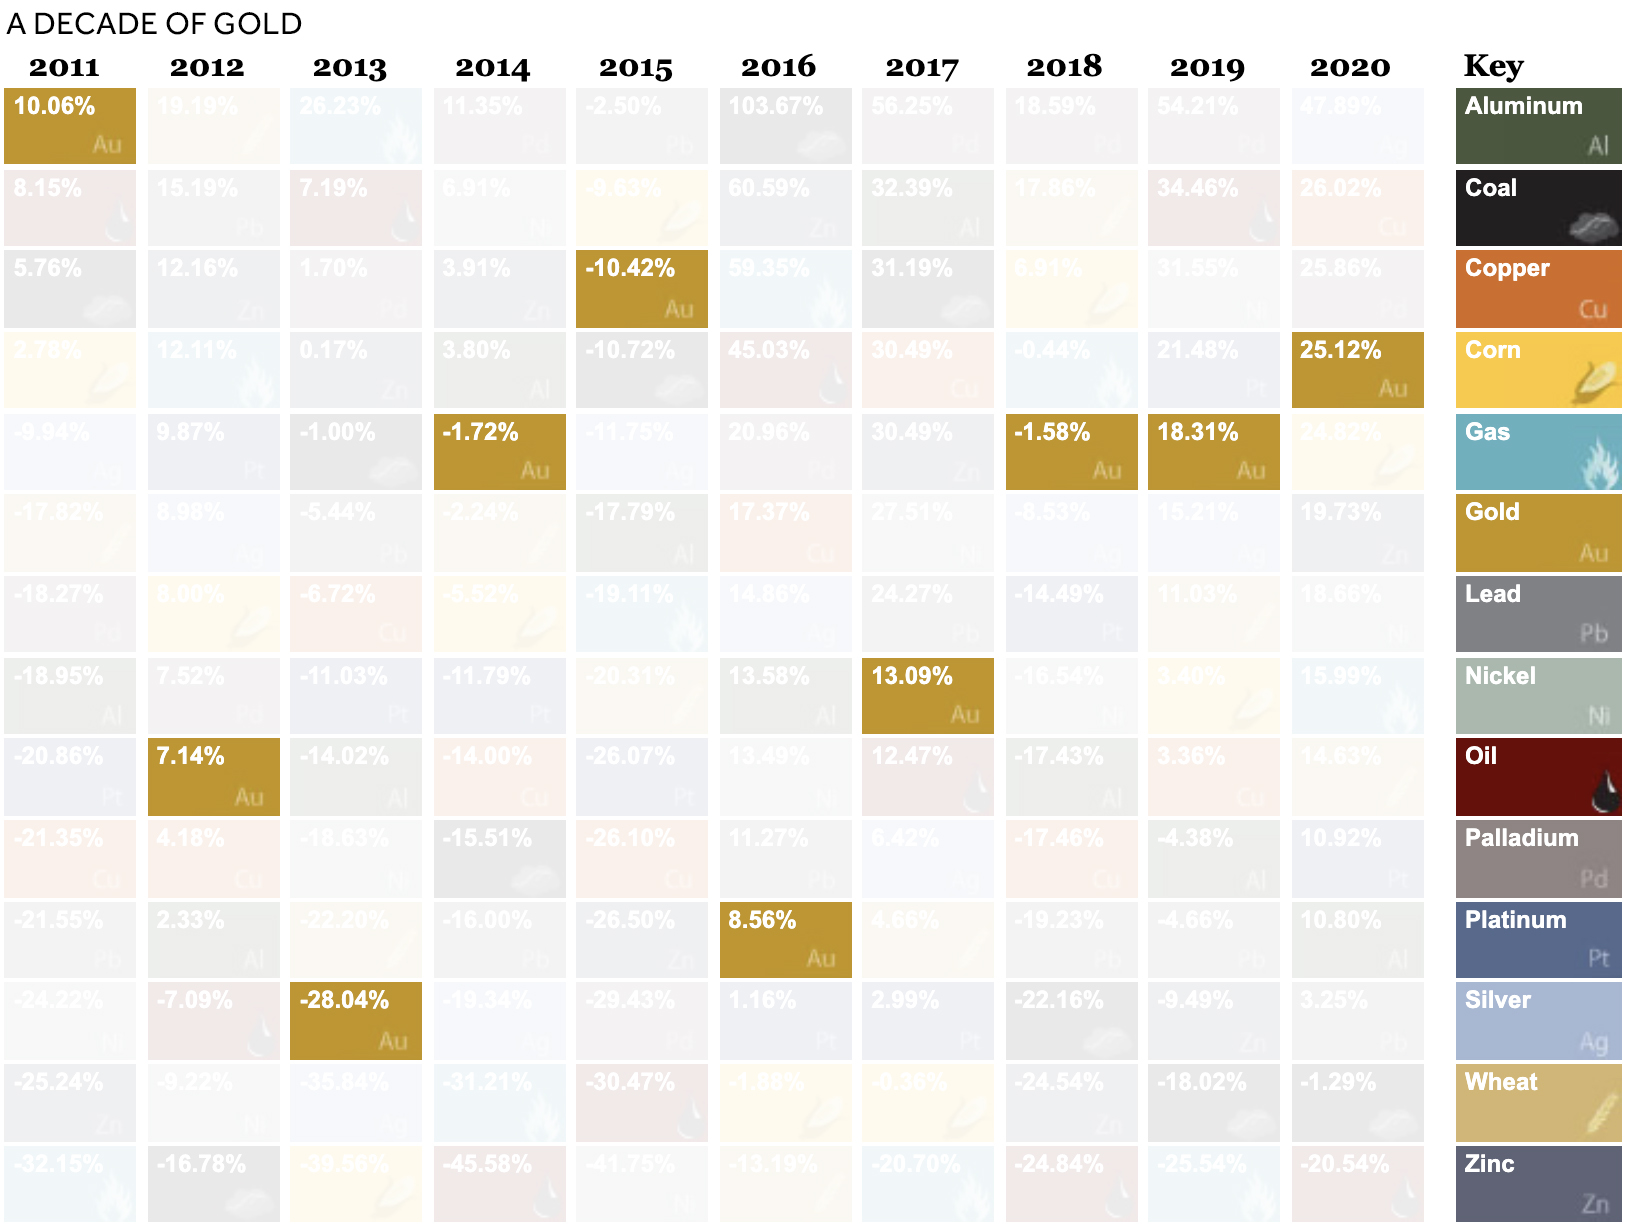
As Gold as the Hills
Like silver, market uncertainty has historically boosted the price of gold. What else contributed to gold’s rise?
U.S. debt continues to climb, pushing down confidence in the U.S. dollar A weaker U.S. dollar makes gold cheaper for other countries to buy Low interest rates kept the returns of other safe haven assets low, making gold more attractive by comparison
Here’s how the price of gold has changed in recent years.
Gold faced its steepest recent declines in 2013, when the Federal Reserve bank discussed tapering down its quantitative easing program in light of economic recovery.
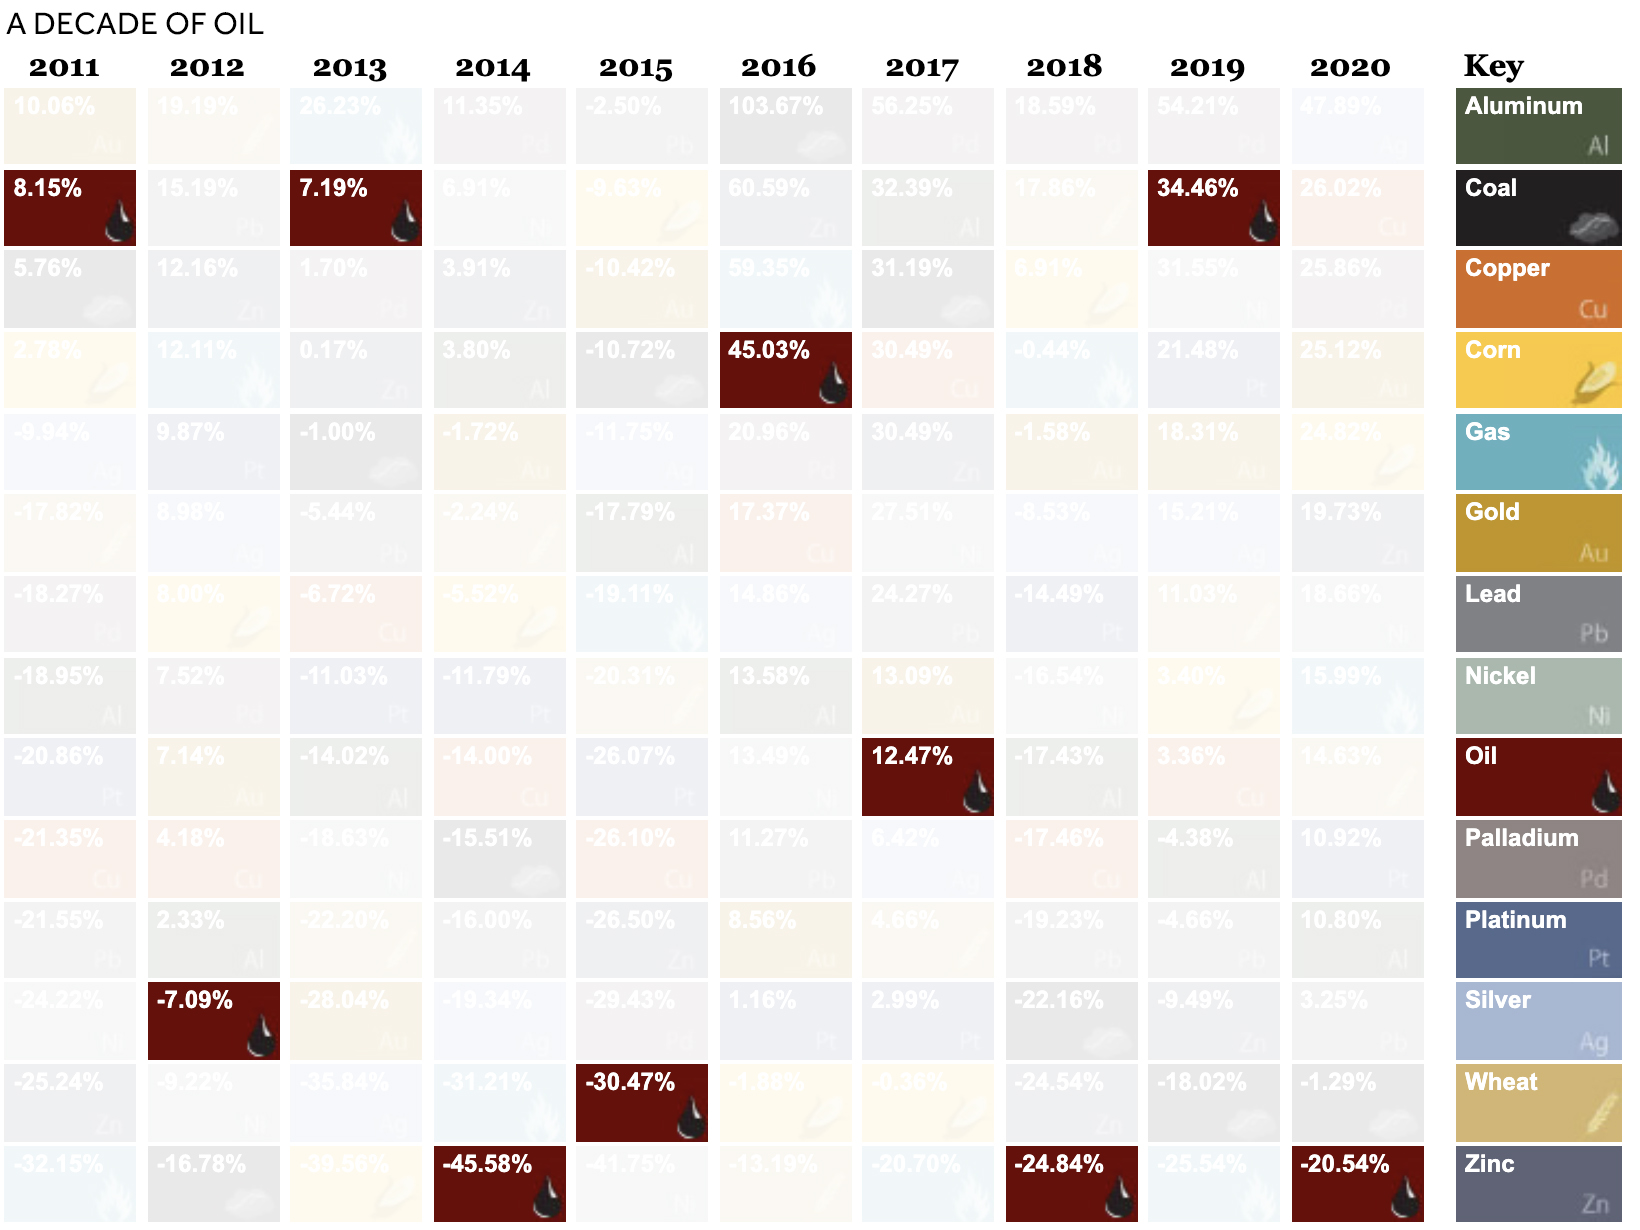
Hitting the Brakes On Oil
Oil suffered the worst commodity price performance in 2020, with -20.5% returns. For the first time in history, oil prices went negative as demand plummeted. To limit its oversupply, oil producers shrunk investment, closed wells, and turned off valves. Unfortunately, many companies still faced bankruptcies. By November, 45 oil producers had proceeded with bankruptcy filings year-to-date. This stood in stark contrast to 2019, when prices soared 34.5%.
As is custom for oil, prices see-sawed over the decade. In 2016 and 2019, it witnessed gains of over 30%. However, like 2020, in 2014 it saw huge losses due to an oversupply of global petroleum. In 2020, total production cuts hit 7.2 million barrels a day in December, equal to 7% of global demand, in response to COVID-19. on
#1: High Reliability
Nuclear power plants run 24/7 and are the most reliable source of sustainable energy. Nuclear electricity generation remains steady around the clock throughout the day, week, and year. Meanwhile, daily solar generation peaks in the afternoon when electricity demand is usually lower, and wind generation depends on wind speeds.As the use of variable solar and wind power increases globally, nuclear offers a stable and reliable backbone for a clean electricity grid.
#2: Clean Electricity
Nuclear reactors use fission to generate electricity without any greenhouse gas (GHG) emissions.Consequently, nuclear power is the cleanest energy source on a lifecycle basis, measured in CO2-equivalent emissions per gigawatt-hour (GWh) of electricity produced by a power plant over its lifetime. The lifecycle emissions from a typical nuclear power plant are 273 times lower than coal and 163 times lower than natural gas. Furthermore, nuclear is relatively less resource-intensive, allowing for lower supply chain emissions than wind and solar plants.
#3: Stable Affordability
Although nuclear plants can be expensive to build, they are cost-competitive in the long run. Most nuclear plants have an initial lifetime of around 40 years, after which they can continue operating with approved lifetime extensions. Nuclear plants with lifetime extensions are the cheapest sources of electricity in the United States, and 88 of the country’s 92 reactors have received approvals for 20-year extensions. Additionally, according to the World Nuclear Association, nuclear plants are relatively less susceptible to fuel price volatility than natural gas plants, allowing for stable costs of electricity generation.
#4: Energy Efficiency
Nuclear’s high energy return on investment (EROI) exemplifies its exceptional efficiency. EROI measures how many units of energy are returned for every unit invested in building and running a power plant, over its lifetime. According to a 2018 study by Weissbach et al., nuclear’s EROI is 75 units, making it the most efficient energy source by some distance, with hydropower ranking second at 35 units.
#5: Sustainable Innovation
New, advanced reactor designs are bypassing many of the difficulties faced by traditional nuclear plants, making nuclear power more accessible.
Small Modular Reactors (SMRs) are much smaller than conventional reactors and are modular—meaning that their components can be transported and assembled in different locations. Microreactors are smaller than SMRs and are designed to provide electricity in remote and small market areas. They can also serve as backup power sources during emergencies.
These reactor designs offer several advantages, including lower initial capital costs, portability, and increased scalability.
A Nuclear-Powered Future
Nuclear power is making a remarkable comeback as countries work to achieve climate goals and ultimately, a state of energy utopia. Besides the 423 reactors in operation worldwide, another 56 reactors are under construction, and at least 69 more are planned for construction. Some nations, like Japan, have also reversed their attitudes toward nuclear power, embracing it as a clean and reliable energy source for the future. CanAlaska is a leading exploration company in the Athabasca Basin, the Earth’s richest uranium depository. Click here to learn more now. In part 3 of the Road to Energy Utopia series, we explore the unique properties of uranium, the fuel that powers nuclear reactors.