And although the broad commodity market finished up 17.6% on the year, the performances of individual commodities were all over the map. For those familiar with the sector, that’s pretty much par for the course. That said, the lack of an obvious correlation in commodity markets also makes for a thought-provoking and humbling exercise: comparing the annual returns of commodities against the data from the past decade.
A Decade of Commodities (2010-2019)
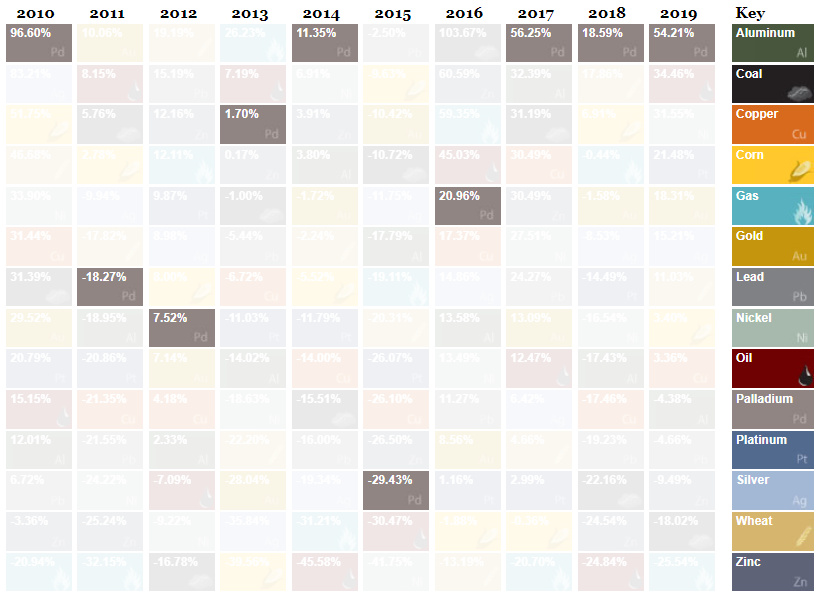
Today’s visualization comes to us from U.S. Global Investors, and it compares individual commodity returns between 2010 and 2019. You can use the interactive tool on their website to toggle between various settings for the table of commodity returns, such as breaking them down by category (i.e. energy, precious metals, etc.), by best and worst performers, or by volatility over the time period. Let’s dive into the data to see what trends we can uncover.
Palladium: The Best Commodity, Three Years Straight
In 2019, palladium finished as the best performing commodity for the third straight year — this time, with a 54.2% return.
You could have bought the precious metal for about $400/oz in early 2010, when it was a fraction of the price of either gold or platinum. Nowadays, thanks to the metal’s ability to reduce harmful car emissions and an uncertain supply situation, palladium trades for above $2,000/oz — making it more expensive per ounce than both gold and platinum.
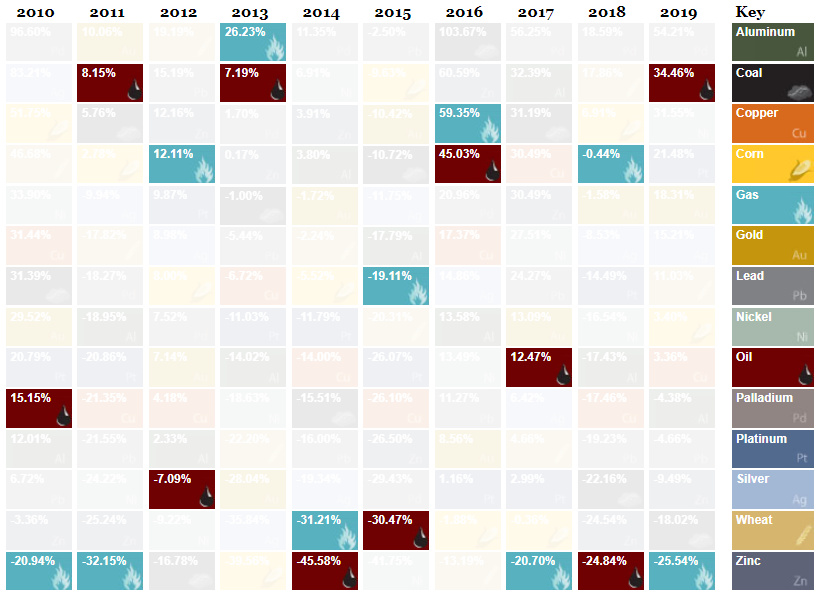
Oil and Gas: Opposite Ends of the Spectrum
As key energy commodities, oil and natural gas have an inherent connection to one another. However, in 2019, the two commodities had completely diverging performances:
Crude oil prices gained 34.5% on the year, making it one of the best commodities for investors — meanwhile, natural gas went the opposite direction, dropping 25.5% on the year. This actually cements gas as the worst performing major commodity of the decade.
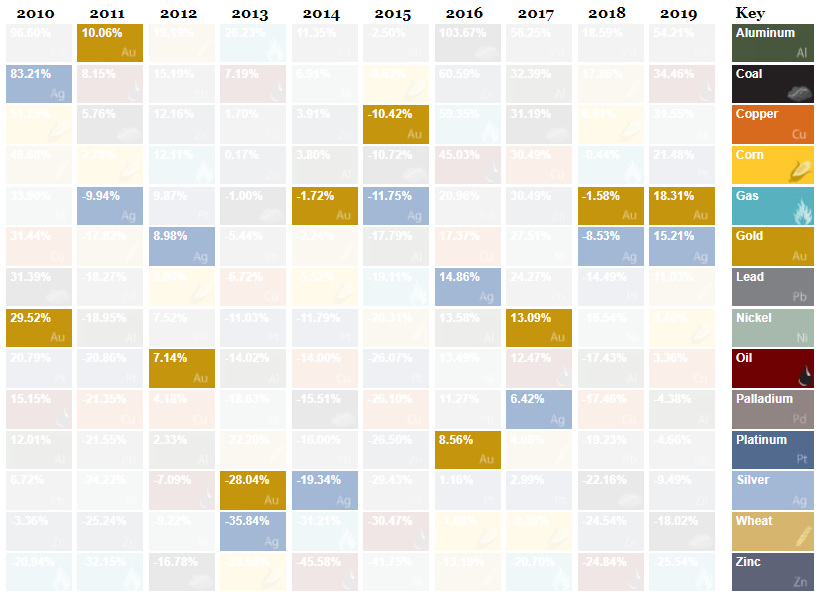
“That’s Gold, Jerry!”
Finally, it’s worth mentioning that gold and silver had a bounceback year. Gold gained 18.3% to finish with the best return the yellow metal has seen in a decade. Silver followed suit with a similar story, rallying 15.2% over the calendar year.
Precious metals now sit at multi-year highs against an interesting economic and geopolitical backdrop to start 2020. Where do you see the above commodities ending up on next year’s edition of the rankings? on Last year, stock and bond returns tumbled after the Federal Reserve hiked interest rates at the fastest speed in 40 years. It was the first time in decades that both asset classes posted negative annual investment returns in tandem. Over four decades, this has happened 2.4% of the time across any 12-month rolling period. To look at how various stock and bond asset allocations have performed over history—and their broader correlations—the above graphic charts their best, worst, and average returns, using data from Vanguard.
How Has Asset Allocation Impacted Returns?
Based on data between 1926 and 2019, the table below looks at the spectrum of market returns of different asset allocations:
We can see that a portfolio made entirely of stocks returned 10.3% on average, the highest across all asset allocations. Of course, this came with wider return variance, hitting an annual low of -43% and a high of 54%.
A traditional 60/40 portfolio—which has lost its luster in recent years as low interest rates have led to lower bond returns—saw an average historical return of 8.8%. As interest rates have climbed in recent years, this may widen its appeal once again as bond returns may rise.
Meanwhile, a 100% bond portfolio averaged 5.3% in annual returns over the period. Bonds typically serve as a hedge against portfolio losses thanks to their typically negative historical correlation to stocks.
A Closer Look at Historical Correlations
To understand how 2022 was an outlier in terms of asset correlations we can look at the graphic below:
The last time stocks and bonds moved together in a negative direction was in 1969. At the time, inflation was accelerating and the Fed was hiking interest rates to cool rising costs. In fact, historically, when inflation surges, stocks and bonds have often moved in similar directions. Underscoring this divergence is real interest rate volatility. When real interest rates are a driving force in the market, as we have seen in the last year, it hurts both stock and bond returns. This is because higher interest rates can reduce the future cash flows of these investments. Adding another layer is the level of risk appetite among investors. When the economic outlook is uncertain and interest rate volatility is high, investors are more likely to take risk off their portfolios and demand higher returns for taking on higher risk. This can push down equity and bond prices. On the other hand, if the economic outlook is positive, investors may be willing to take on more risk, in turn potentially boosting equity prices.
Current Investment Returns in Context
Today, financial markets are seeing sharp swings as the ripple effects of higher interest rates are sinking in. For investors, historical data provides insight on long-term asset allocation trends. Over the last century, cycles of high interest rates have come and gone. Both equity and bond investment returns have been resilient for investors who stay the course.