After a difficult year marred by rising geopolitical tensions in the Middle East and crude prices in the $50-60 per barrel range, analysts warned that the energy sector needed a strong recovery to offset a rising (and expiring) mountain of debt. Instead, the oil patch has seen one bombshell after another, and the impacts are adding up.
Fueling the Wave’s Growth
The new year opened with a U.S. attack on a top-ranking Iranian general in Baghdad, followed by an Iranian counterattack on two bases in Iraq that hosted U.S. military personnel. Then, the energy industry worried that the Organization of the Petroleum Exporting Countries (OPEC) wouldn’t renew its production deal with non-member countries, causing increased production and negative pressure on crude prices. All the while, the threat of COVID-19 grew and started to spread. In March, the new coronavirus hit markets hardest, right as the OPEC+ deal collapsed. Russia and Saudi Arabia subsequently flooded the markets with cheap oil, starting a price war to drive out competition. What developed was the perfect storm of nonexistent demand matched up against oversupply. Crude prices plummeted and hit a historic sub-zero low on April 20th, with futures for West Texas Intermediate (WTI) Crude closing at -$37.63.
The Wave’s Initial Damage
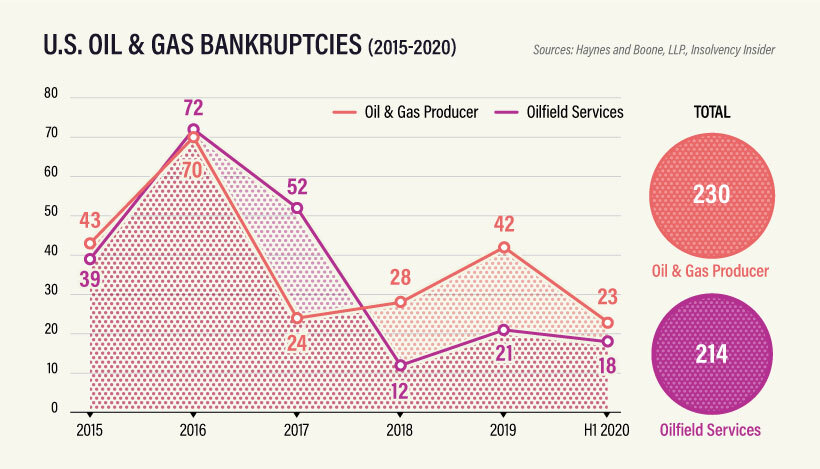
Now, following a renewed OPEC+ deal limiting production agreed upon on April 9th and slowly restarting economies driving up crude demand, prices have started to tick up. Unfortunately, the damage has already been done and will take a long time to recover. By charting the sector’s bankruptcies over the first half of 2020—tracked by law firm Haynes and Boone, LLP for the U.S. and Insolvency Insider for Canada—we can see the wave start to swell: For oil and gas producers, the second quarter of 2020 saw 18 bankruptcies, the highest quarterly total since 2016. So far, they’re largely centered in the U.S., which saw a boom of surface-level shale oil production in the 2010’s to take advantage of rising crude prices. As prices have dropped, many heavily leveraged companies have started to run out of options. The biggest victim in the first half of 2020 was Chesapeake Energy, a shale giant that declared bankruptcy on June 28 with more than $9 billion in debt. Canada has also seen an uptick in energy bankruptcies, especially after facing years of stiff competition from U.S. shale producers. However, the number of cases in Canada is far fewer than in the United States. One reason is that companies staved off bankruptcy or receivership in four of the seven insolvency cases in Canada since January 2020, at least temporarily. Instead, they are seeking protection under the country’s Companies’ Creditors Arrangement Act, giving them a chance to restructure and avoid insolvency.
A Prolonged Fallout
Another reason for the discrepancy in bankruptcy numbers is timing. The energy sector faced its biggest challenges in 2015/2016, causing many companies to take on debt.
Unfortunately, much of that debt is starting to expire, or becoming too difficult to pay off in the current market conditions. That’s why, despite the wave of bankruptcies caused by COVID-19 gaining steam, the wave will continue well into 2020 and likely beyond. July has already seen more companies declaring bankruptcy or seeking creditor protection. The question is, how many more are waiting to surface? on Last year, stock and bond returns tumbled after the Federal Reserve hiked interest rates at the fastest speed in 40 years. It was the first time in decades that both asset classes posted negative annual investment returns in tandem. Over four decades, this has happened 2.4% of the time across any 12-month rolling period. To look at how various stock and bond asset allocations have performed over history—and their broader correlations—the above graphic charts their best, worst, and average returns, using data from Vanguard.
How Has Asset Allocation Impacted Returns?
Based on data between 1926 and 2019, the table below looks at the spectrum of market returns of different asset allocations:
We can see that a portfolio made entirely of stocks returned 10.3% on average, the highest across all asset allocations. Of course, this came with wider return variance, hitting an annual low of -43% and a high of 54%.
A traditional 60/40 portfolio—which has lost its luster in recent years as low interest rates have led to lower bond returns—saw an average historical return of 8.8%. As interest rates have climbed in recent years, this may widen its appeal once again as bond returns may rise.
Meanwhile, a 100% bond portfolio averaged 5.3% in annual returns over the period. Bonds typically serve as a hedge against portfolio losses thanks to their typically negative historical correlation to stocks.
A Closer Look at Historical Correlations
To understand how 2022 was an outlier in terms of asset correlations we can look at the graphic below:
The last time stocks and bonds moved together in a negative direction was in 1969. At the time, inflation was accelerating and the Fed was hiking interest rates to cool rising costs. In fact, historically, when inflation surges, stocks and bonds have often moved in similar directions. Underscoring this divergence is real interest rate volatility. When real interest rates are a driving force in the market, as we have seen in the last year, it hurts both stock and bond returns. This is because higher interest rates can reduce the future cash flows of these investments. Adding another layer is the level of risk appetite among investors. When the economic outlook is uncertain and interest rate volatility is high, investors are more likely to take risk off their portfolios and demand higher returns for taking on higher risk. This can push down equity and bond prices. On the other hand, if the economic outlook is positive, investors may be willing to take on more risk, in turn potentially boosting equity prices.
Current Investment Returns in Context
Today, financial markets are seeing sharp swings as the ripple effects of higher interest rates are sinking in. For investors, historical data provides insight on long-term asset allocation trends. Over the last century, cycles of high interest rates have come and gone. Both equity and bond investment returns have been resilient for investors who stay the course.