This week’s chart uses data from Steve Hanke of the Cato Institute, and it visualizes the 2019 Misery Index rankings, across 95 countries that report this data on a consistent basis. The index uses four key economic variables to rank and score countries: Here are the Misery Index scores for all 95 countries: To calculate each Misery Index score, a simple formula is used: GDP per capita growth is subtracted from the sum of unemployment, inflation, and bank lending rates. Which of these factors are driving scores in some of the more “miserable” countries? Which countries rank low on the list, and why?
The Highest Misery Index Scores
Two Latin American countries, Venezuela and Argentina, rank near the top of Hanke’s index.
1. Vexation in Venezuela
Venezuela holds the title of the most “miserable” country in the world for the fourth consecutive year in a row. According to the United Nations, four million Venezuelans have left the country since its economic crisis began in 2014. Turmoil in Venezuela has been further fueled by skyrocketing hyperinflation. Citizens struggle to afford basic items such as food, toiletries, and medicine. The Cafe Con Leche Index was created specifically to monitor the rapidly changing inflation rates in Venezuela. Not only does Venezuela have the highest score in the Misery Index, but its score has also seen a dramatic increase over the past year as the crisis has accelerated.
2. Argentina’s History of Volatility
Argentina is the second most “miserable” country, which comes as no surprise given the country’s history of economic crises. The 2018 Argentine monetary crisis caused a severe devaluation of the peso. The downfall forced the President, Mauricio Macri, to request a loan from the International Monetary Fund (IMF). To put things in perspective, this is the 22nd lending arrangement between Argentina and the IMF. Only six countries have had more commitments to the international organization, including Haiti (27) and Colombia (25).
The Lowest Misery Index Scores
The two countries with the lowest scores in the index have one thing in common: extremely low rates of unemployment.
1. Why Thailand is the Land of Smiles
Thailand takes the prize as the least “miserable” country in the world on the index. The country’s unemployment rate has been remarkably low for years, ranging between 0.4% and 1.2% since 2011. This is the result of the country’s unique structural factors. The “informal” sectors—such as street vendors or taxi drivers—absorb people who become unemployed in the “formal” sector. Public infrastructure investments by the Thai government continue to attract both private domestic and foreign investments, bolstering the country’s GDP alongside tourism and exports.
2. Hungary’s Prime Minister Sets the Score
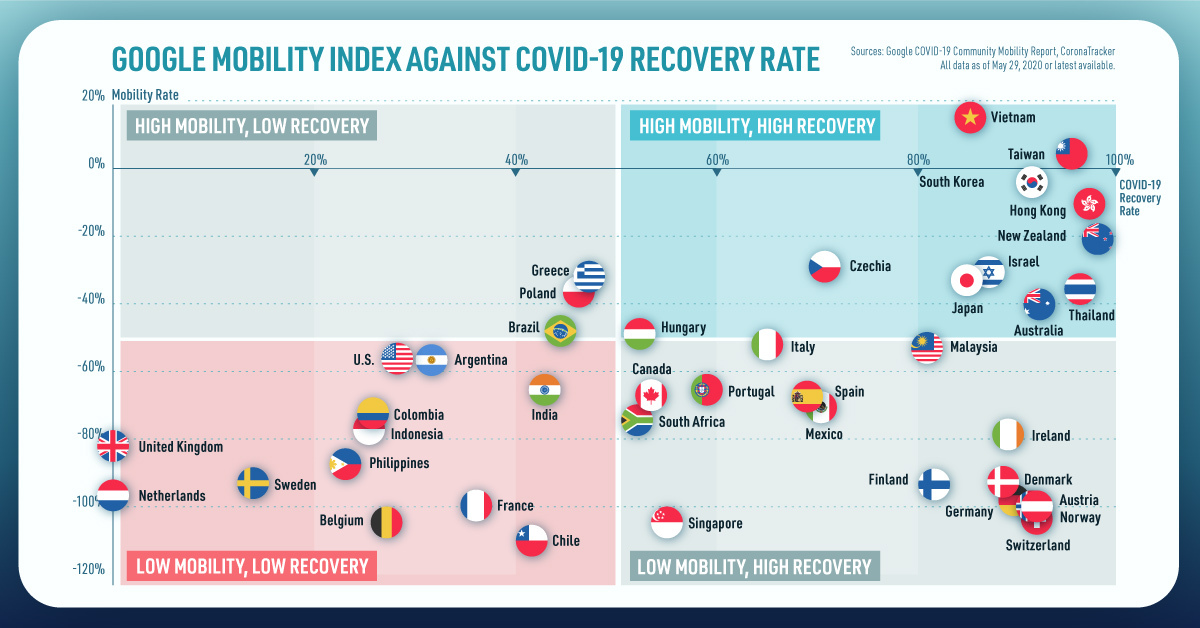
Hungary is the second least “miserable” country in the world according to the index. In 2010, Prime Minister Viktor Orbán implemented a workfare program which diverted menial tasks to thousands of job seekers. Over the same period that the program ran, the national unemployment rate fell from 11.4% to 3.8%. Orbán won a controversial fourth term in 2018, possibly in part due to promises to protect the country’s sovereignty against the European Union. Despite accusations of populism and even authoritarian tendencies, the Prime Minister still commands a strong following in Hungary. on Today’s chart measures the extent to which 41 major economies are reopening, by plotting two metrics for each country: the mobility rate and the COVID-19 recovery rate: Data for the first measure comes from Google’s COVID-19 Community Mobility Reports, which relies on aggregated, anonymous location history data from individuals. Note that China does not show up in the graphic as the government bans Google services. COVID-19 recovery rates rely on values from CoronaTracker, using aggregated information from multiple global and governmental databases such as WHO and CDC.
Reopening Economies, One Step at a Time
In general, the higher the mobility rate, the more economic activity this signifies. In most cases, mobility rate also correlates with a higher rate of recovered people in the population. Here’s how these countries fare based on the above metrics. Mobility data as of May 21, 2020 (Latest available). COVID-19 case data as of May 29, 2020. In the main scatterplot visualization, we’ve taken things a step further, assigning these countries into four distinct quadrants:
1. High Mobility, High Recovery
High recovery rates are resulting in lifted restrictions for countries in this quadrant, and people are steadily returning to work. New Zealand has earned praise for its early and effective pandemic response, allowing it to curtail the total number of cases. This has resulted in a 98% recovery rate, the highest of all countries. After almost 50 days of lockdown, the government is recommending a flexible four-day work week to boost the economy back up.
2. High Mobility, Low Recovery
Despite low COVID-19 related recoveries, mobility rates of countries in this quadrant remain higher than average. Some countries have loosened lockdown measures, while others did not have strict measures in place to begin with. Brazil is an interesting case study to consider here. After deferring lockdown decisions to state and local levels, the country is now averaging the highest number of daily cases out of any country. On May 28th, for example, the country had 24,151 new cases and 1,067 new deaths.
3. Low Mobility, High Recovery
Countries in this quadrant are playing it safe, and holding off on reopening their economies until the population has fully recovered. Italy, the once-epicenter for the crisis in Europe is understandably wary of cases rising back up to critical levels. As a result, it has opted to keep its activity to a minimum to try and boost the 65% recovery rate, even as it slowly emerges from over 10 weeks of lockdown.
4. Low Mobility, Low Recovery
Last but not least, people in these countries are cautiously remaining indoors as their governments continue to work on crisis response. With a low 0.05% recovery rate, the United Kingdom has no immediate plans to reopen. A two-week lag time in reporting discharged patients from NHS services may also be contributing to this low number. Although new cases are leveling off, the country has the highest coronavirus-caused death toll across Europe. The U.S. also sits in this quadrant with over 1.7 million cases and counting. Recently, some states have opted to ease restrictions on social and business activity, which could potentially result in case numbers climbing back up. Over in Sweden, a controversial herd immunity strategy meant that the country continued business as usual amid the rest of Europe’s heightened regulations. Sweden’s COVID-19 recovery rate sits at only 13.9%, and the country’s -93% mobility rate implies that people have been taking their own precautions.
COVID-19’s Impact on the Future
It’s important to note that a “second wave” of new cases could upend plans to reopen economies. As countries reckon with these competing risks of health and economic activity, there is no clear answer around the right path to take. COVID-19 is a catalyst for an entirely different future, but interestingly, it’s one that has been in the works for a while. —Carmen Reinhart, incoming Chief Economist for the World Bank Will there be any chance of returning to “normal” as we know it?





title: “Visualizing The Most Miserable Countries In The World” ShowToc: true date: “2023-02-04” author: “Robert Wallace”
Visualizing the Most Miserable Countries in the World
The Money Project is an ongoing collaboration between Visual Capitalist and Texas Precious Metals that seeks to use intuitive visualizations to explore the origins, nature, and use of money. Every year, the Cato Institute publishes a list of the world’s most “miserable countries” by using a simple economic formula to calculate the scores. Described as a Misery Index, the tally for each country can be found by adding the unemployment rate, inflation, and lending rate together, and then subtracting the change in real GDP per capita.
Disaster in Venezuela
According to the think tank, countries with misery scores over 20 are “ripe for reform”. If that’s true, then socialist Venezuela is way overdue.
The troubled nation finished with a misery score of 214.9, the highest marker in 2015 by far. Unfortunately, the number is not looking better for this year, as the IMF has projected that hyperinflation will top 720% by the end of 2016. For the average Venezuelan, that means that food staples and other necessities will be doubling in price every four months.
Hyperinflation has taken its toll on citizens already. Three years ago, one US dollar could buy four Venezuelan bolivars. Today, one dollar can buy more than 1,000 bolivars on the black market. If the inflation rate keeps accelerating, the situation could approach a similar trajectory to hyperinflation in Weimar Germany, where rates eventually catapulted to one trillion percent after six years.
While hyperinflation is certainly one of Venezuela’s biggest concerns, the nation has also been short on luck lately. The Zika virus has hit the country hard, and the oil crash has created political, economic, and social tensions in a nation that depends on oil exports to balance the budget. Three in four Venezuelans have fallen into poverty, and the country’s GDP is expected to contract 8% in 2016.
Venezuelans are now facing dire shortages for many necessities, including power. Droughts have caused mayhem on the country’s hydro reservoirs, making blackouts common and widespread. Food, medical supplies, and toilet paper are in short supply, and even beer production has been shut down.
Key Stats:
Approval Rating of Nicolas Maduro: 26.8% People in poverty: 76% Oil exports, as a percent of total revenue: 96% Homicides per capita: 2nd highest in world Good shortages: Power, medical supplies, food, toilet paper, beer Fiscal deficit: 20% of GDP
Recent measures taken to dampen the crisis in Venezuela have been bold. The government has moved entire time zones while reducing the work week of public sector workers to try and work around power deficiencies. Meanwhile, minimum wage earners have been given a 30% raise to keep up with inflation. However, the crisis may be coming to a head. A recent survey shows that 87% of Venezuelans do not have enough money to purchase enough food to meet their needs, and people are getting restless. In early May, the opposition party submitted a list 1.85 million signatures to the electoral commission to seek a recall referendum against President Nicolas Maduro. Days after the submission, the leader of an opposition party was found dead after being shot in the head. Unless the country gets ruled with an iron fist, the level of misery can only reach a certain point before the people take decisive action.
About the Money Project
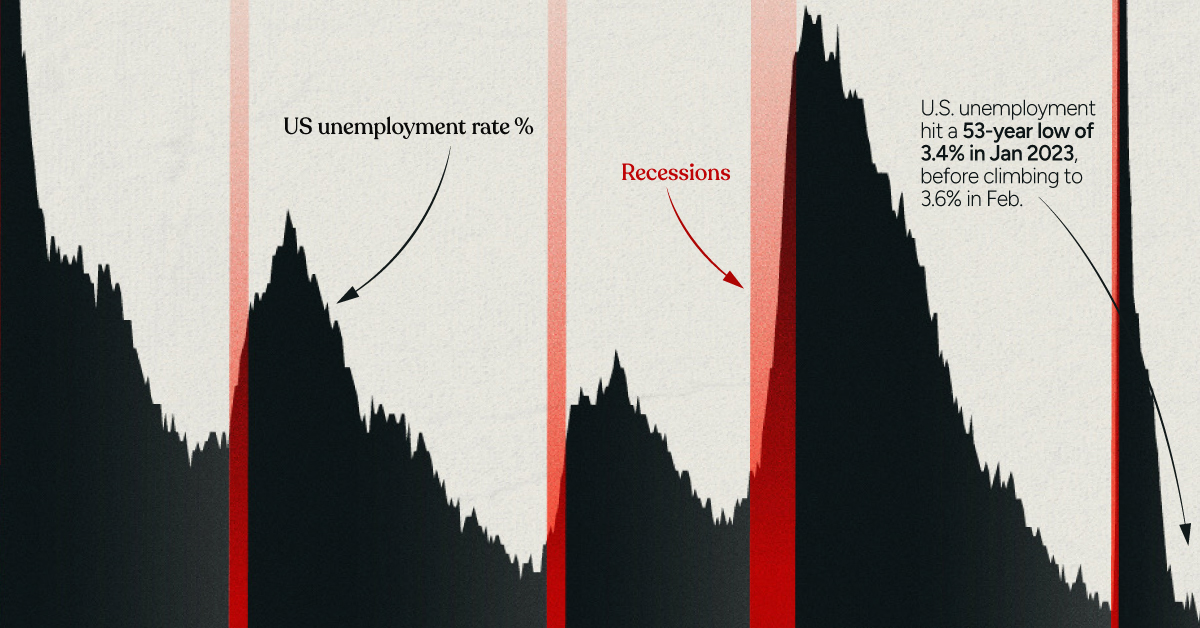
The Money Project aims to use intuitive visualizations to explore ideas around the very concept of money itself. Founded in 2015 by Visual Capitalist and Texas Precious Metals, the Money Project will look at the evolving nature of money, and will try to answer the difficult questions that prevent us from truly understanding the role that money plays in finance, investments, and accumulating wealth. on Both figures surpassed analyst expectations by a wide margin, and in January, the unemployment rate hit a 53-year low of 3.4%. With the recent release of February’s numbers, unemployment is now reported at a slightly higher 3.6%. A low unemployment rate is a classic sign of a strong economy. However, as this visualization shows, unemployment often reaches a cyclical low point right before a recession materializes.
Reasons for the Trend
In an interview regarding the January jobs data, U.S. Treasury Secretary Janet Yellen made a bold statement: While there’s nothing wrong with this assessment, the trend we’ve highlighted suggests that Yellen may need to backtrack in the near future. So why do recessions tend to begin after unemployment bottoms out?
The Economic Cycle
The economic cycle refers to the economy’s natural tendency to fluctuate between periods of growth and recession. This can be thought of similarly to the four seasons in a year. An economy expands (spring), reaches a peak (summer), begins to contract (fall), then hits a trough (winter). With this in mind, it’s reasonable to assume that a cyclical low in the unemployment rate (peak employment) is simply a sign that the economy has reached a high point.
Monetary Policy
During periods of low unemployment, employers may have a harder time finding workers. This forces them to offer higher wages, which can contribute to inflation. For context, consider the labor shortage that emerged following the COVID-19 pandemic. We can see that U.S. wage growth (represented by a three-month moving average) has climbed substantially, and has held above 6% since March 2022. The Federal Reserve, whose mandate is to ensure price stability, will take measures to prevent inflation from climbing too far. In practice, this involves raising interest rates, which makes borrowing more expensive and dampens economic activity. Companies are less likely to expand, reducing investment and cutting jobs. Consumers, on the other hand, reduce the amount of large purchases they make. Because of these reactions, some believe that aggressive rate hikes by the Fed can either cause a recession, or make them worse. This is supported by recent research, which found that since 1950, central banks have been unable to slow inflation without a recession occurring shortly after.
Politicians Clash With Economists
The Fed has raised interest rates at an unprecedented pace since March 2022 to combat high inflation. More recently, Fed Chairman Jerome Powell warned that interest rates could be raised even higher than originally expected if inflation continues above target. Senator Elizabeth Warren expressed concern that this would cost Americans their jobs, and ultimately, cause a recession. Powell remains committed to bringing down inflation, but with the recent failures of Silicon Valley Bank and Signature Bank, some analysts believe there could be a pause coming in interest rate hikes. Editor’s note: just after publication of this article, it was confirmed that U.S. interest rates were hiked by 25 basis points (bps) by the Federal Reserve.


