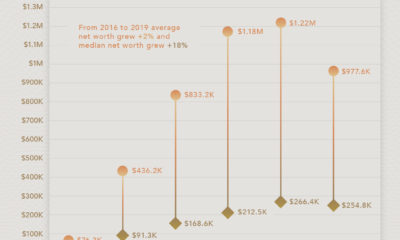
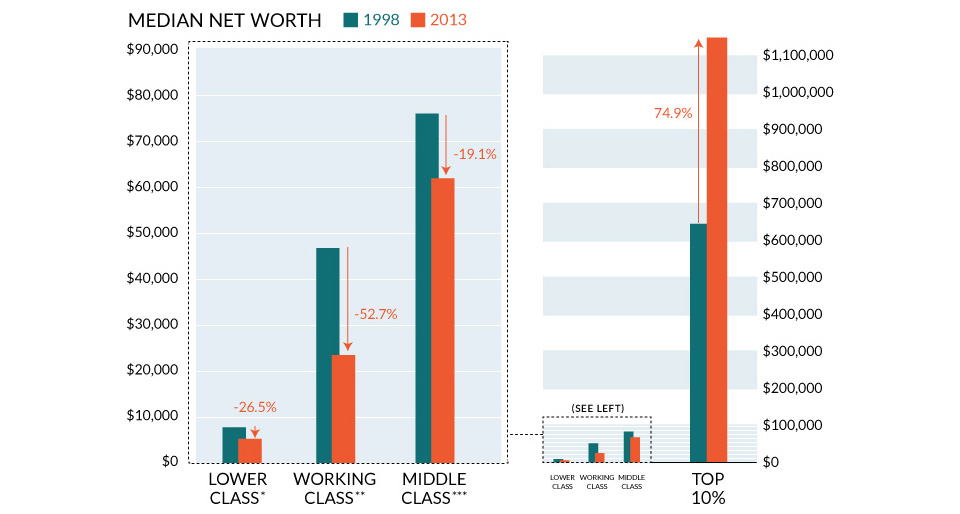
For example, someone with a net worth of $1 million several decades ago would have been considered very wealthy. According to recent survey results, however, $1 million is only enough to feel “financially comfortable” today. In this infographic, we’ve visualized several money milestones to give you a better idea of what it really takes to be wealthy in America.
Net Worth Milestones
This table lists the data used in the above infographic. It covers data on what it takes to get into the top one percent for wealth in key states, along with broader survey results about what net worth thresholds must be crossed in order to be considered “comfortable financially” or even “wealthy”. According to Charles Schwab’s Modern Wealth Survey, a net worth of $774,000 is needed to feel “financially comfortable”, while $2.2 million is needed to be considered “wealthy”. Both of these milestones are far greater than the average (median) American’s wealth, which according to the Federal Reserve, was $122,000 in 2019.
Joining the One Percent
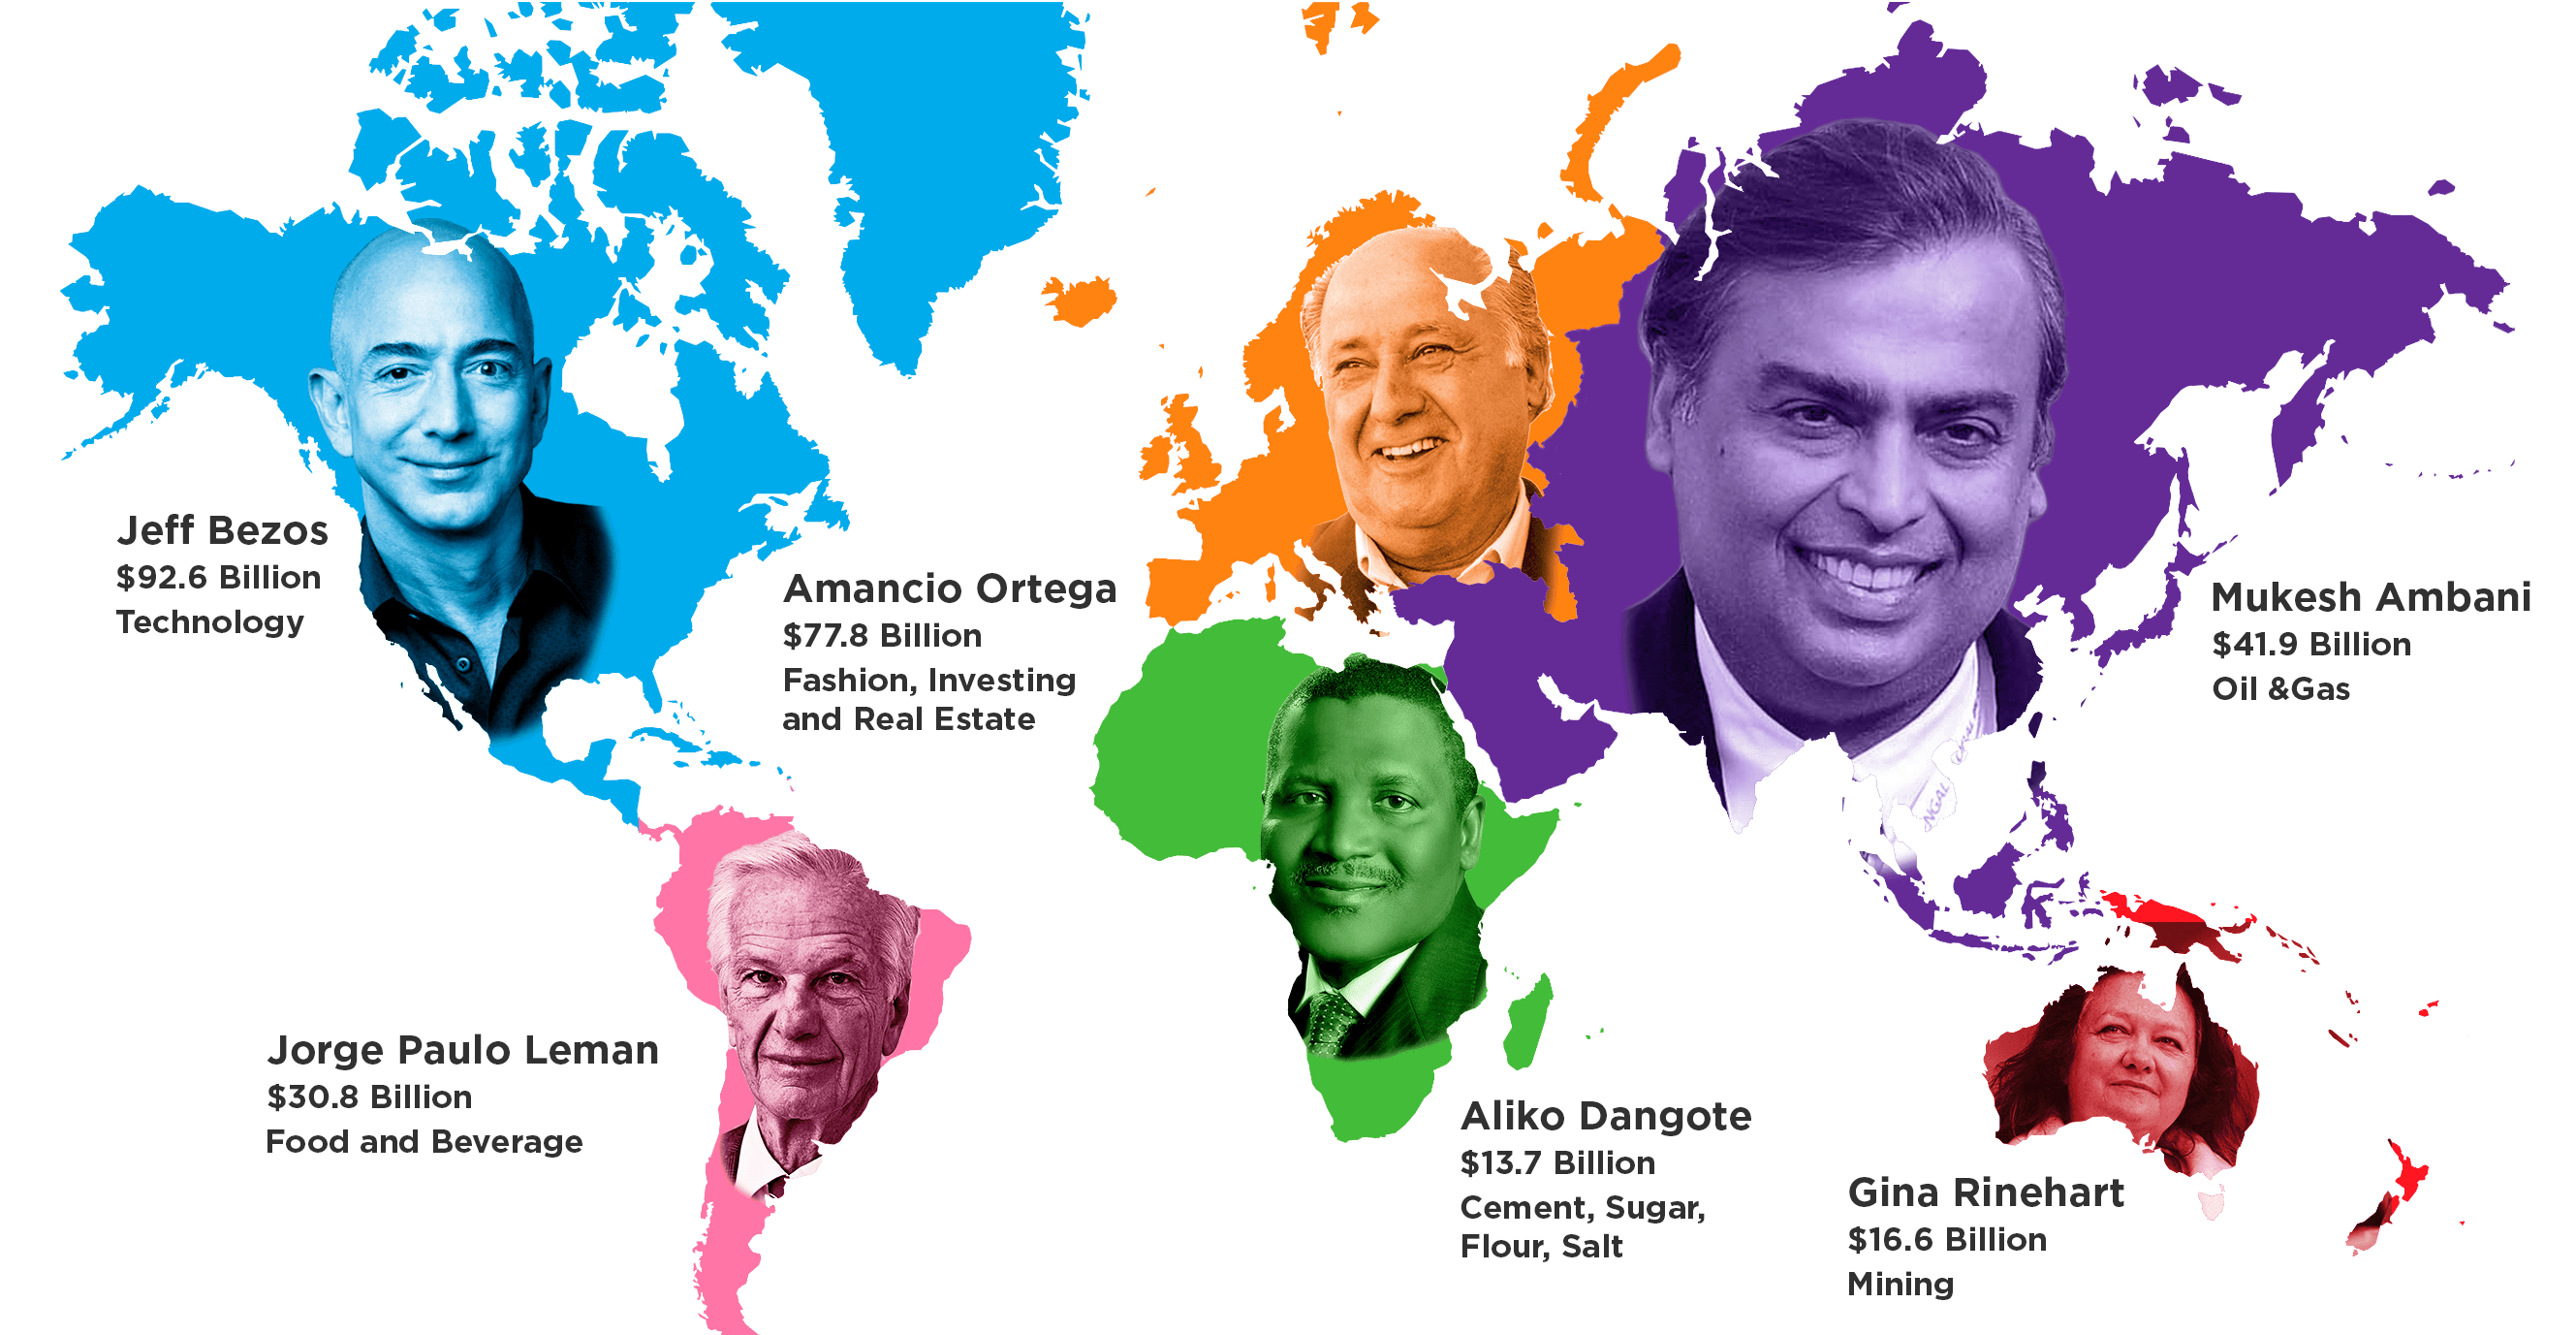
Research by Knight Frank determined that in order to be a member of America’s one percent, one would need a net worth of $4.4 million. This is very high compared to other developed countries such as Japan ($1.5 million), the UK ($1.8 million), and Australia ($2.8 million). The difference is partly due to America’s large population of ultra high net worth individuals, which includes the country’s 724 billionaires. See below for a list of the top five countries by number of billionaires. Source: World Population Review (As of 2021) Focusing again on the U.S., we can also see large discrepancies at the individual state level. Entry into California’s one percent requires a net worth of $6.8 million, which is 62% higher than the national average. California is famously home to many of the world’s richest people, including Google co-founder Larry Page, and Facebook founder Mark Zuckerberg. Being a one percenter in Mississippi, on the other hand, requires $766,000. That’s 83% lower than the national average, and just a tad lower than the amount needed to be “financially comfortable” by the average American. This is partially due to Mississippi’s poverty rate of 19.6%, which according to the U.S. Census Bureau, is the highest in the country. on To see how the minimum wage differs around the world, we’ve visualized data from Picodi, which includes values for 67 countries as of January 2023.
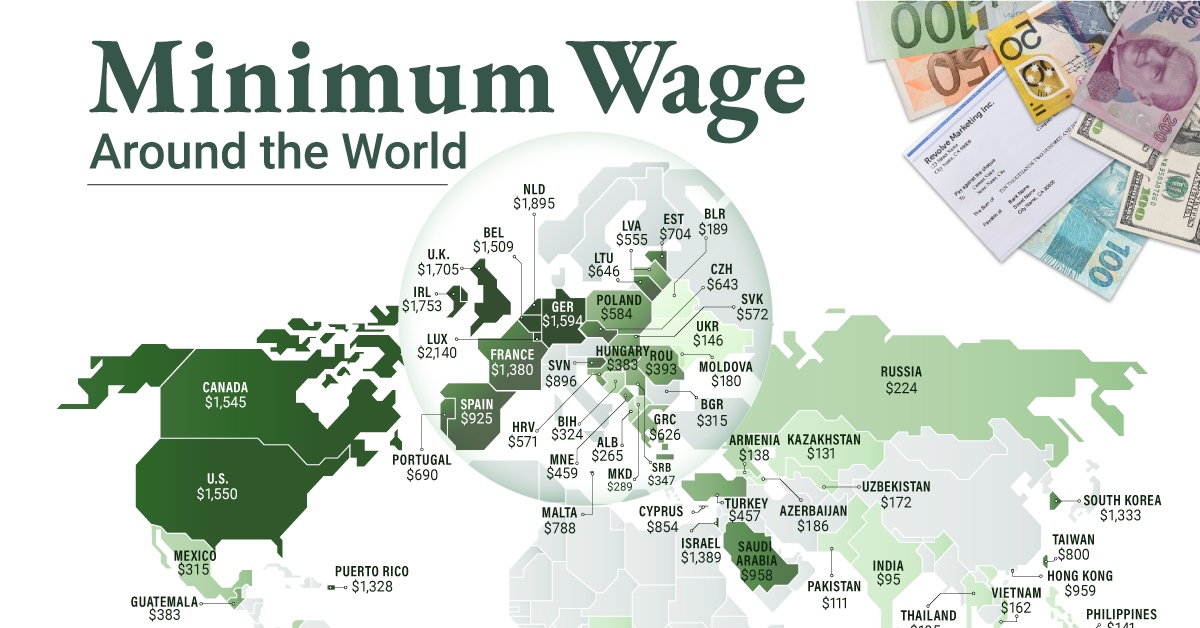
Monthly Minimum Wage, by Country
The following table includes all of the data used in this infographic. Each value represents the monthly minimum wage a full-time worker would receive in each country. Picodi states that these figures are net of taxes and have been converted to USD. Generally speaking, developed countries have a higher cost of living, and thus require a higher minimum wage. Two outliers in this dataset are Argentina and Turkey, which have increased their minimum wages by 100% or more from January 2022 levels. Turkey is suffering from an ongoing currency crisis, with the lira losing over 40% of its value in 2021. Prices of basic goods have increased considerably as the Turkish lira continues to plummet. In fact, a 2022 survey found that 70% of people in Turkey were struggling to pay for food. Argentina, South America’s second-biggest economy, is also suffering from very high inflation. In response, the country announced three minimum wage increases throughout 2022.
Minimum Wage in the U.S.
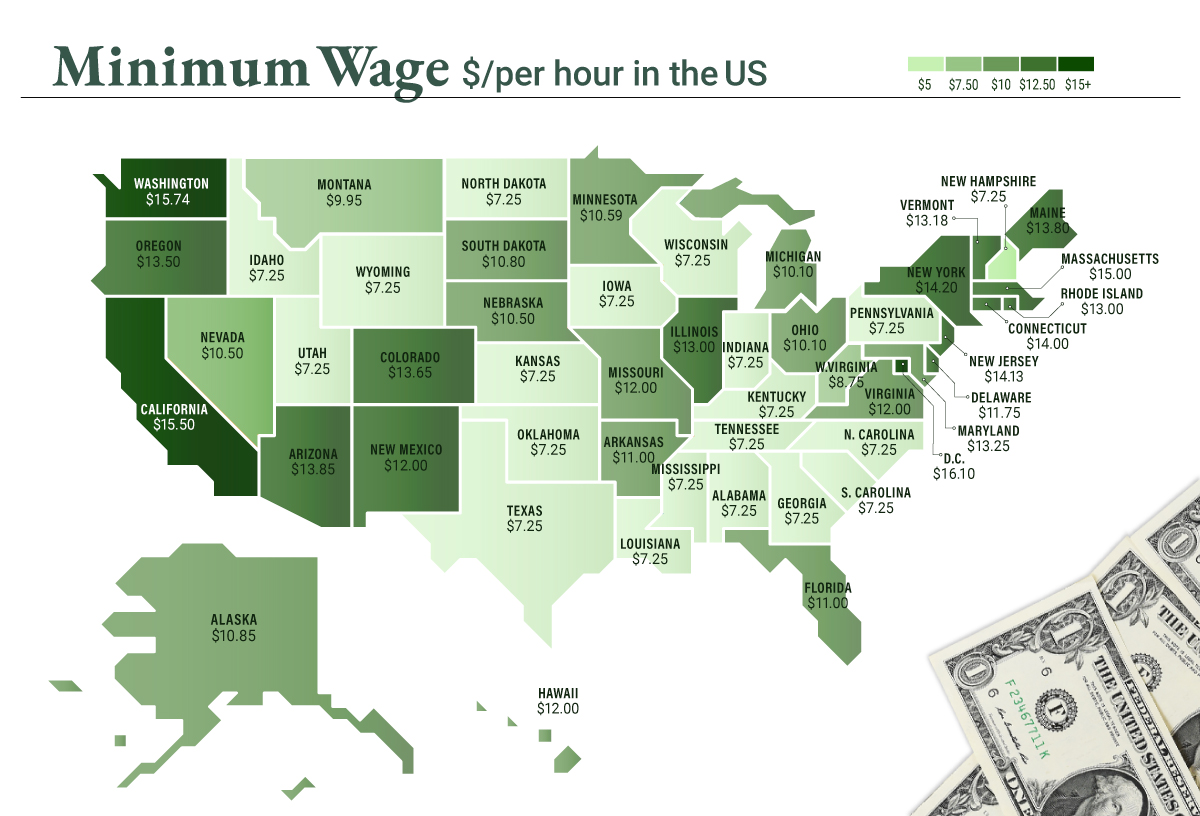
Within the U.S., minimum wage varies significantly by state. We’ve visualized each state’s basic minimum rate (hourly) using January 2023 data from the U.S. Department of Labor.
2023-03-17 Update: This map was updated to fix several incorrect values. We apologize for any confusion this may have caused. America’s federal minimum wage has remained unchanged since 2009 at $7.25 per hour. Each state is allowed to set their own minimum wage, as long as it’s higher than the federal minimum. In states that do not set their own minimum, the federal minimum applies. If we assume someone works 40 hours a week, the federal minimum wage of $7.25 translates to an annual figure of just $15,080 before taxes. California’s minimum wage of $15.50 translates to $32,240 before taxes. For further perspective, check out our 2022 infographic on the salary needed to buy a home across 50 U.S. cities.


