Natural gas prices have risen since Russia’s invasion of Ukraine, exacerbating an already tight supply situation. Making matters worse, Moscow has since cut gas exports to Europe to multi-year lows, sending Europe’s gas price to almost 10 times its pre-war average. Using data from BP’s Statistical Review of World Energy, the above infographic provides further context on the gas market by visualizing the world’s largest gas producers in 2021.
Natural Gas Consumption at All-Time High in 2021
Natural gas is part of nearly every aspect of our daily lives. It is used for heating, cooking, electricity generation, as fuel for motor vehicles, in fertilizers, and in the manufacture of plastics. The fuel is a naturally occurring hydrocarbon gas and non-renewable fossil fuel that forms below the Earth’s surface. Although the Earth has enormous quantities of natural gas, much of it is in areas far from where the fuel is needed. To facilitate transport and reduce volume, natural gas is frequently converted into liquefied natural gas (LNG), in a process called liquefaction. Despite global efforts to reduce reliance on fossil fuels, natural gas consumption reached a new all-time high in 2021, surpassing the previous record set in 2019 by 3.3%. Demand is expected to decline slightly in 2022 and remain subdued up to 2025, according to the International Energy Agency. The Asia Pacific region and the industrial sector are expected to be the main drivers of global gas consumption in the coming years
Natural Gas Production, by Country
The world’s top 10 producers of natural gas account for about 73% of total production. Natural gas accounts for 32% of primary energy consumption in the United States, the world’s largest producer. Russia is the second biggest producer, and also has at least 37 trillion cubic meters of natural gas reserves, the most in the world. China’s natural gas production grew by 7.8% in 2021, and it has nearly doubled since 2011. This sustained growth in production is partly down to government policies incentivizing coal-to-gas switching.
Europe’s Natural Gas Crisis
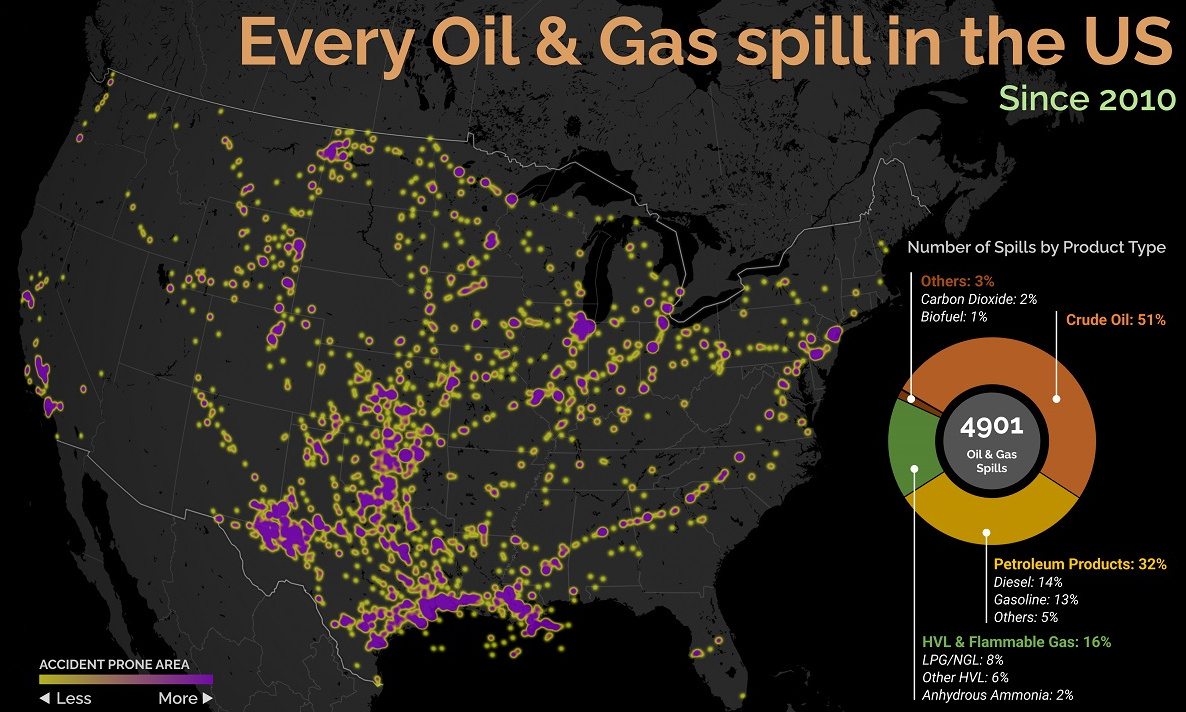
Russia has significantly reduced flows of natural gas to Europe since Western nations imposed sanctions on the Kremlin following the invasion of Ukraine. Before the war, the European Union (EU) imported about 40% of its natural gas from Russia. The gas is transported by the Nord Stream system, a pair of offshore natural gas pipeline networks in Europe that run under the Baltic Sea from Russia to Germany. Russian energy giant Gazprom recently halved the amount of natural gas flowing through the Nord Stream 1 pipeline to 20% of capacity, blaming Western sanctions for a delay in the delivery in a necessary turbine. EU officials say Russia is “weaponizing” its gas supply. Amid tensions, the EU bloc outlined a plan to phase out dependence on Russian fossil fuels. Lithuania ceased Russian gas imports at the beginning of April. Estonia’s and Latvia’s imports also dropped to zero at the start of that month. Bulgaria, the Netherlands, and Poland all announced that they do not intend to renew long-term contracts with Gazprom. Despite these efforts, Europe remains dependent on Russia for its supply of natural gas, at least in the short and medium term. on Aside from the obvious climate impact they bring, one other downside in particular is spills, which can lead to ecological and economic damage. These can happen due to pipeline leaks, train derailments, or other industrial disasters. This graphic from Preyash Shah provides a visual overview of every oil and gas spill in the contiguous U.S. since 2010. Data is tracked by the U.S. government’s Pipeline and Hazardous Materials Safety Administration (PHMSA).
U.S. Oil and Gas Spills (2010‒2022)
The majority of spills that have occurred come mostly from crude oil, followed by petroleum products and gas. Note that this data covers the quantity of spills and not damages or volume.
Crude oil, which makes up just over half of documented spills, is also one of the most costly. Contaminations can persist for years after a spill, and its impact on local mammals and waterfowl is particularly harsh. This has been the case with the Deepwater Horizon spill (also known as the “BP oil spill”), which experts say is still causing harm in the Gulf of Mexico. Other products with lots of spills include petroleum products such as diesel or gasoline, as well as liquefied natural gas or other volatile liquids. Interestingly, liquefied carbon dioxide can also be transported in pipelines, commonly used for carbon capture storage, but requires high pressure to maintain its state. When looking at the location of spills, it’s clear that the South Central states have experienced the highest number of disasters. In contrast, the West Coast has had substantially less activity. However, this makes much more sense when looking at the dominant oil producing states, where Texas and surrounding neighbors reign supreme. Of the 4,901 spills during this period, Texas accounts for 1,936 or roughly 40% of all oil and gas spills. This is followed by Oklahoma, which has had 407 spills and is one of the largest net exporters of oil and gas in the country.
What Causes Spills?
Oil and gas spills actually have a surprisingly long history, with one of the earliest dating back to 1889, when a spill was reported on the coast between Los Angeles and San Diego. Causes have consisted primarily of weather, natural disasters, equipment and technological malfunction, as well as human error. However, they only became a widespread problem around the halfway mark of the 20th century, when petroleum extraction and production really began to take off. This era also saw the emergence of supertankers, which can transport half a million tons of oil but therefore make the risk of spills even costlier. In fact, the biggest spill off U.S. waters after the Deepwater Horizon disaster is the 1989 Exxon Valdez spill in Alaska, when a tanker crashed into a reef and 11 million gallons of oil spilled into the Pacific Ocean.