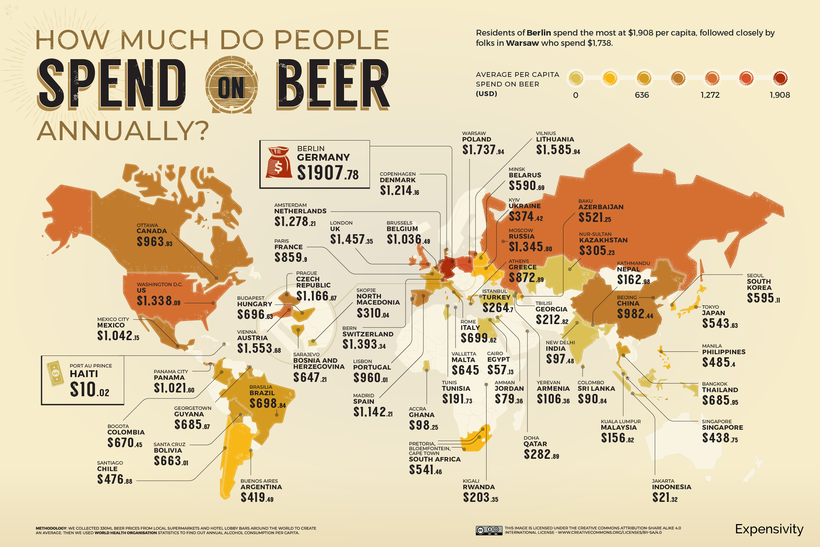
This World Beer Index from Expensivity compares the average price of a bottle of beer in 58 countries in a detailed map. Additionally, we show which countries spend the most on beer per capita, and just how much beer people really drink.
Pricey Pints: The Average Beer Price
Researchers calculated the average price of a typical bottle of beer (330ml, just shy of a pint) from well known brands via online stores and statistics database Numbeo. In addition, local beer prices were pulled from hotel and bar menus, and average values converted to USD. In Qatar, you’d have to shell out $11.26 for a single beer, which would surely make for a really expensive night out on the town. In part, this is because in 2019, the Muslim-majority country introduced a 100% excise tax on top the previous sales price of all alcohol imports. These steep prices are aimed at tourists—and with Qatar hosting the 2022 men’s soccer World Cup, there’ll be thousands of visitors in the country looking for a cold one at any price. At just $1.68 per bottle, South Africa has the lowest average beer price thanks at least partially to cultural norms of buying in bulk.
Cashing In: The Per Capita Spend on Beer
The price of a single beer is one thing, but which countries spend the most on beer itself? Germany unsurprisingly tops the list here with nearly $2,000 of expenditures per capita, bolstered by its strong beer culture and annual Oktoberfest celebration. Germany also prides itself on the purity of its beer—the vast majority of brewers follow the Reinheitsgebot, centuries-old purity laws that broadly state that beer may contain only three ingredients: water, barley, and hops. View the high resolution of this infographic by clicking here. Following closely behind is Poland, which spends $1,738 per capita. Meanwhile, the U.S. ranks eighth in the world for the highest spending on beer per capita at $1,554—beer is also the country’s most popular alcoholic beverage.
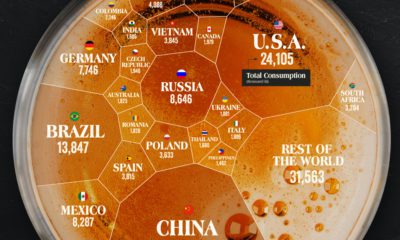
Getting Boozy: How Much Beer Do People Drink?
Using data from the World Health Organization, the visualization below also digs into how much beer is consumed around the world per capita. The Czech Republic emerges on top in this regard, with 468 beers on average in a year—that works out to 1.3 beers per day. Spain and Germany are next with 417 and 411 beers, respectively. View the high resolution of this infographic by clicking here. On the flip side, people in Haiti only drink about four beers yearly. This may be because they prefer something a little stronger—97% of alcohol consumption in the nation comes from spirits such as rum. Beer has been around for over 7,000 years. No matter the beer price in your country, it’s worth raising a glass to the timelessness of this humble beverage. on Last year, stock and bond returns tumbled after the Federal Reserve hiked interest rates at the fastest speed in 40 years. It was the first time in decades that both asset classes posted negative annual investment returns in tandem. Over four decades, this has happened 2.4% of the time across any 12-month rolling period. To look at how various stock and bond asset allocations have performed over history—and their broader correlations—the above graphic charts their best, worst, and average returns, using data from Vanguard.
How Has Asset Allocation Impacted Returns?
Based on data between 1926 and 2019, the table below looks at the spectrum of market returns of different asset allocations:
We can see that a portfolio made entirely of stocks returned 10.3% on average, the highest across all asset allocations. Of course, this came with wider return variance, hitting an annual low of -43% and a high of 54%.
A traditional 60/40 portfolio—which has lost its luster in recent years as low interest rates have led to lower bond returns—saw an average historical return of 8.8%. As interest rates have climbed in recent years, this may widen its appeal once again as bond returns may rise.
Meanwhile, a 100% bond portfolio averaged 5.3% in annual returns over the period. Bonds typically serve as a hedge against portfolio losses thanks to their typically negative historical correlation to stocks.
A Closer Look at Historical Correlations
To understand how 2022 was an outlier in terms of asset correlations we can look at the graphic below:
The last time stocks and bonds moved together in a negative direction was in 1969. At the time, inflation was accelerating and the Fed was hiking interest rates to cool rising costs. In fact, historically, when inflation surges, stocks and bonds have often moved in similar directions. Underscoring this divergence is real interest rate volatility. When real interest rates are a driving force in the market, as we have seen in the last year, it hurts both stock and bond returns. This is because higher interest rates can reduce the future cash flows of these investments. Adding another layer is the level of risk appetite among investors. When the economic outlook is uncertain and interest rate volatility is high, investors are more likely to take risk off their portfolios and demand higher returns for taking on higher risk. This can push down equity and bond prices. On the other hand, if the economic outlook is positive, investors may be willing to take on more risk, in turn potentially boosting equity prices.
Current Investment Returns in Context
Today, financial markets are seeing sharp swings as the ripple effects of higher interest rates are sinking in. For investors, historical data provides insight on long-term asset allocation trends. Over the last century, cycles of high interest rates have come and gone. Both equity and bond investment returns have been resilient for investors who stay the course.